Research Note
Nonlinearities of the Sabotage-Redistribution Process
by Shimshon Bichler and Jonathan Nitzan [1]
Jerusalem and Montreal, May 19, 2014
![]()
A recent exchange on capitalaspower.com, titled ‘Capitalizing Time’, suggests a possible confusion regarding our claims, so a clarification is in order. Over the years, we have argued that the relationship between sabotage and distribution tends to be nonlinear. Up to a point, sabotage redistributes income in favour of those who impose it; but after that point, sabotage becomes ‘excessive’ and the effect inverts. One illustration of this nonlinearity is given by the relationship between unemployment and the capital share of income.
In ‘Capitalizing Time’, Blair Fix plots this relationship, with the income share of capitalists on the vertical axis and the rate of unemployment on the horizontal axis. However, the low-pixel graphics of the chart are too crude to reveal the nonlinearity. Figure 1 corrects this shortcoming. It shows the same relationship, but with finer graphics that make the nonlinearity visible (the definitions and sources for all figures are given in the Appendix). Note that, unlike Blair, we use the capital share of domestic income rather than of national income. The reason is that the latter measure includes foreign profit and interest, which are unaffected by domestic unemployment. In practice, though, the two sets of data yield similar results.
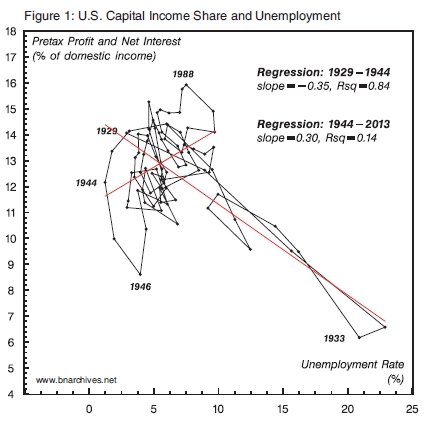
Now, if we treat the entire 1929-2013 period as representing a single pattern, the relationship is negative. But we can also think of this history as representing two very different regimes, separated by what econometricians call ‘structural change’: (1) the prewar period (16 years), when sabotage was excessive and unemployment undermined the capitalist share of income (regression slope = –0.35); and (2) the postwar era (70 years), when, following a structural change, sabotage has become strategic and unemployment has boosted the share of capital (regression slope = +0.3).
To see the nonlinearity more clearly, Figure 2 smoothes the two variables as 5-year moving averages. The difference between the two regimes is now easier to discern. The negative prewar relationship is almost linear, while the positive postwar relationship is tighter than the one shown with the unsmoothed data. This relationship, using national income data, was first plotted in our paper ‘Capital Accumulation: Breaking the Dualism of “Economics” and “Politics”’ (Nitzan and Bichler 2000: Figure 5.2, p. 80) and later updated in various publications.
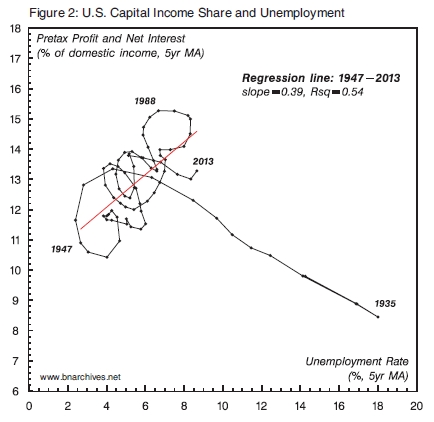
Figure 3 takes the analysis a step further by showing the relationship between the income share of capital and the rate of unemployment three year earlier (with both series still expressed as 5-year moving averages). The same relationship – though without the prewar data – was shown in Figures 15 and 16 of our paper ‘Can Capitalists Afford Recovery: Economic Policy When Capital is Power’ (Bichler and Nitzan 2013).
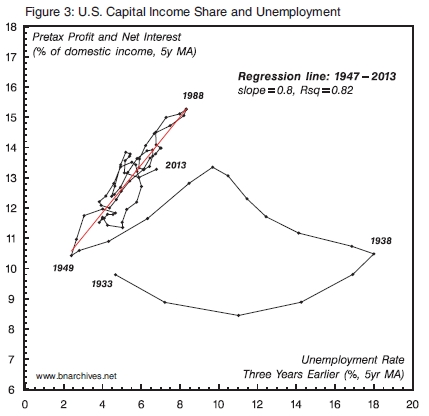
All three figures indicate a nonlinearity; this nonlinearity becomes clearer as we smooth the data; and the positive effect of strategic sabotage in the postwar period grows much tighter when we use unemployment with a three-year lag. These regularities suggest that strategic sabotage takes time to creorder the distribution of income. In principle, one can estimate this process with a distributed-lag regression, with the capital income share as the variable of interest and lagged values of unemployment as carriers; unfortunately, though, the high multicollinearity of the carriers will likely prevent us from assessing their distinct impacts.
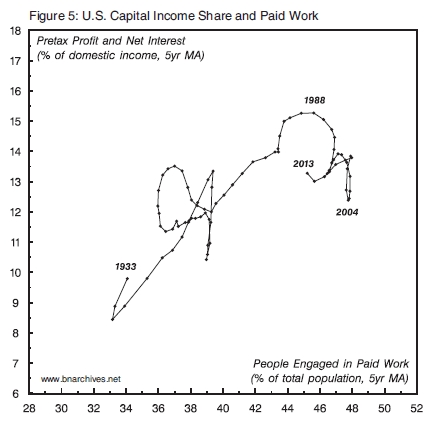
Figure 4 shows Blair’s original relationship between the capital share of income (which, here too, we measure as a proportion of domestic rather than national income) and the per cent of the population engaged in paid work. To enable comparison with the previous three charts, we switch Blair’s axes, putting the capital share of income on the vertical axis and the proportion of paid workers on the horizontal one.
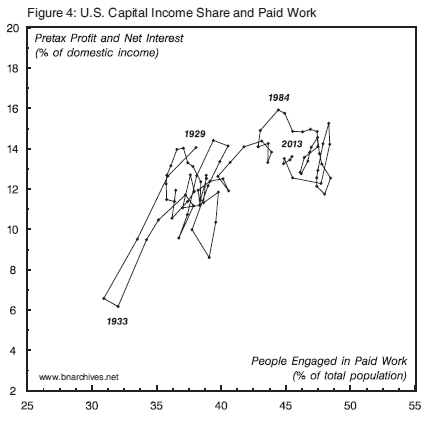
Our interpretation of this relationship is that the proportion of the population in paid work reflects the ability of capitalists to force people into the capitalization process, and that this process is a manifestation of capitalist power. But the effect of this power is nonlinear as well: beyond a certain point the underlying sabotage becomes ‘excessive’, the relationship experiences a ‘structural change’ and the impact on the capitalist share of income inverts. In the United States, this inversion appears to have happened after 1984: as the proportion of the population in paid work rose beyond 45 per cent, the income share of capital started to drop. Figure 5 smoothes both variables as 5-year moving averages, yielding a sharper picture of this nonlinearity.
Appendix: Definitions and Sources
Domestic income. Source: U.S. Bureau of Economic Analysis through Global Insight (series codes: GDY).
Domestic net interest. Source: U.S. Bureau of Economic Analysis through Global Insight (series codes: INTNETDBUS).
Domestic profit. Reported pretax and includes capital consumption adjustment (CCAdj) and inventory valuation adjustment (IVA). Source: U.S. Bureau of Economic Analysis through Global Insight (series codes: ZBECOND).
Population. Source: Historical Statistics of the United States: Earliest Times to the Present, Millennial Edition (online) (series code: Aa7 [till 1929]); U.S. Bureau of the Census through Global Insight (series code: N@US [from 1930 onward]).
Unemployment. Expressed as a share of the labour force. Source: Historical Statistics of the United States, Earliest Times to the Present: Millennial Edition (online) (series code: Unemployed_AsPercentageOf_CivilianLaborForce_Ba475_Percent [till 1947]); U.S. Bureau of Labor Statistics through Global Insight (series code: RUC, computed as annual averages of monthly data [1948 onward]).
Endnotes
[1] Shimshon Bichler teaches political economy at colleges and universities in Israel. Jonathan Nitzan teaches political economy at York University in Canada. All of their publications are available for free on The Bichler & Nitzan Archives (http://bnarchives.net). Research for this paper was partly supported by the SSHRC.
References
Bichler, Shimshon, and Jonathan Nitzan. 2013. Can Capitalists Afford Recovery? Economic Policy When Capital is Power. Working Papers on Capital as Power (2013/01, October): 1-36.
Nitzan, Jonathan, and Shimshon Bichler. 2000. Capital Accumulation: Breaking the Dualism of "Economics" and "Politics". In Global Political Economy: Contemporary Theories, edited by R. Palan. New York and London: Routledge, pp. 67-88.