Working Papers on Capital as Power, No. 2014/04, November 2014
Still About Oil?
Shimshon Bichler and Jonathan Nitzan [1]
Jerusalem and Montreal, November 2014
bnarchives.net / Creative Commons
![]()
Abstract
During the late 1980s and early 1990s, we identified a new Middle East phenomenon that we called ‘energy conflicts’ and argued that these conflicts were intimately linked with the global processes of capital accumulation. This paper outlines the theoretical framework we have developed over the years and brings our empirical research up to date. It shows that the key stylized patterns we discovered more than twenty years ago – along with other regularities we have uncovered since then – remain pretty much unchanged: (1) conflict in the region continues to correlate tightly with the differential profits of the Weapondollar-Petrodollar Coalition, particularly the oil companies; (2) dominant capital continues to depend on stagflation to substitute for declining corporate amalgamation; and (3) capitalists the world over now need inflation to offset the spectre of debt deflation. The convergence of these interests bodes ill for the Middle East and beyond: all of these groups stand to benefit from higher oil prices, and oil prices rarely if ever rise without there being an energy conflict in the Middle East.
1. The Triangle of Conflict
Analyses of modern Middle East conflicts vary greatly. They range from sweeping regional histories to narratives of individual disputes. They draw on various analytical frameworks and reflect different ideological standpoints. They rely on realism to emphasize state interests, alignments and conflicts, on liberalism to accentuate markets, trade and interest groups, on Marxism to stress exploitation, dependency and imperialism, and on postism to transform both the conflicts and their causes into a cultural-ethnic-racist collage of deconstructible ‘texts’. They use these views, opinions and dogmas to critique and condemn, rationalize and moralize, predict and strategize.
Underlying this great variety, however, lies a simple triangular scheme. Regardless of their particular theoretical foci and ideological bent, all analyses seem to derive from and accentuate one or more of the following themes: (1) outside intervention, (2) culture and internal politics and (3) scarcity.
Outside intervention. Analysts of international relations tend to divide the history of foreign intervention in the region into four broad eras: (i) the period up till the Second World War, (ii) the post-war stretch till the collapse of the Soviet Union, (iii) the era of neoliberal globalization till the recent financial crisis and (iv) the new period of growing multipolarity. Foreign meddling in the Middle East is said to have intensified during the nineteenth century. With the decline of Ottoman rule and the rise of European imperialism, direct colonial takeovers carved up the region among the leading European powers. This division ended after the Second World War. Colonialism disintegrated, and with superpower confrontation substituting for inter-imperial struggles, proxy conflicts replaced the need for direct occupation. The 1990s collapse of the Soviet Union again shuffled the cards. The previously bipolar world was rendered unipolar, and this unipolarity, argue the pundits, enabled the United States to launch an aggressive regime-changing campaign to promote democracy and make the Middle safe for business. But this era too seems to be drawing to a close. The United States is not what it used to be. Its chronic current account deficit, mounting debt, sliding dollar and recent financial crisis, along with its failed military interventions, have given rise to mounting challenges from China, India and the new Russia, among others countries, as well as from armed NGOs in various parts of the world. These centrifugal forces create peripheral vacuums, including in the Middle East, which local mini-powers such as Iran and Turkey and militias like ISIS and Hezbollah jockey to fill.
Culture and internal politics. The issue here is the bellicose consequences of the region’s tribal traditions, ethnic differences and religious hostilities – as well as the ways in which these cultural-political traits differ from those in other, mainly Western societies. Oriental pundits, analysts and deconstructivists examine how cultural incompatibilities breed conflict within the Middle East, as well as a broader ‘clash of civilizations’, particularly between Islam and the West. Some claim that the region’s cultural-political bellicosities are deeply ingrained and therefore difficult to change, while others see them as malleable attributes that can be smothered or nourished depending on circumstances and expediency.
Scarcity. This subject is handled more or less exclusively by economists. The main focus here is water, which the region is short on, and oil, of which it has plenty. In the short term, say the economists, the overall supply of both water and oil can be taken as given, so the ups and downs of their scarcity depend mostly on variations in demand. In the case of water, the demand originates within the Middle East itself – particular in arid or heavily populated areas – so water-related conflicts are mostly regional in nature. By contrast, the demand for oil is generated largely outside the region, so oil-related conflicts tend to have an important global dimension. In the long-run, though, supply too is changing. The main emphasis here is on global warming, which dries up the region, and Peak Oil, which is bound to reduce its petroleum output. Anticipations of these supply-driven scarcities, many now claim, have already heightened resource-related tensions in the region and are sure to intensify its conflicts and wars.
Of course, the three nodes of this conceptual triangle, although analytically distinct, are rarely treated in isolation. On the contrary. Typically, the analyst collects a few ‘factors’ from each node, tucking them all into a single ‘production function’ in order to generate a hopefully richer, more complex discourse. This fusion is evident in current explanations of the third Gulf War. ISIS’s media blitzes – and the counter-campaigns of its opponents – emphasize the religious basis of the conflict. But culture is only part of the picture. Having already captured oil-producing regions and facilities, ISIS openly boasts of its intention to take over those of Iraq, Saudi Arabia and others. And with human rights and the flow of oil under threat, there is a good enough reason for a U.S.-led coalition to launch yet another military intervention in the Middle East.
2. Scarcity and the Price of Oil
Now, a vigilant reader might protest that this triangular classification is fatally incomplete. It is certainly important to speak about international relations, culture, politics and scarcity, she would point out. But what about capital? Doesn’t capitalism rule our world and shape its important trajectories? And if that is the case, why is the connection between Middle East wars and accumulation rarely mentioned explicitly and seldom analysed empirically?
Most analysts, though, would dismiss such a critique as amateurish. The nexus between capital accumulation and Middle East conflict, they would point out, is already there, embedded in the very concept of scarcity.
Securing the Flow of Oil?
According to the conventional creed, both liberal and radical, capital is an economic category, a ‘real’, ‘productive’ entity whose accumulation is more or less synonymous with economic growth. [2] In order to accumulate and expand, say the economists, capital needs access to cheap raw materials, especially energy. And since the Middle East currently holds roughly one-half of the world’s proven crude-oil reserves and accounts for one-third of its daily output, it is in the interest of capitalists – and of oil-consuming economies more generally – to ensure, violently if necessary, that this oil remains accessible, free flowing and cheap.
Seen from this viewpoint, the three episodes of the Gulf-War series – i.e., the 1990-91 attack on Iraq, the 2001-03 invasions of Afghanistan and Iraq, and the 2014 assault on ISIS – can be seen as part of a long-term scarcity-reducing operation and therefore integral to the accumulation of capital. Officially, of course, each conflict has its own reasons. In the first episode, the excuse was kicking Saddam Hussein out of Kuwait; in the second, it was eliminating Al-Qaeda from Afghanistan and ridding Iraq of its weapons of mass destruction; and in the third, it is eradicating ISIS from the face of the earth. But in the mind of most analysts, there is also an abiding common denominator: the need to make oil ample and inexpensive, so that capitalists can continue to accumulate and the world economy can continue to grow. [3]
The scarcity-reducing rationale is both popular and appealing. It sits well with the conventional mantras of neoclassical economics, it resonates with international relations, and it helps decorate cultural texts. Few academics protest it, the media heavily advertises it, and the masses love to buy it. All in all, then, it seems pretty much beyond dispute – save for one little problem: it doesn’t align with the facts.
The difficulty is twofold. First, military intervention in the Middle East has intensified since the early 2000s – yet, this intensification has done little to keep the price of oil low; if anything, it has caused it to soar. Second, and perhaps more importantly, there is in fact no evidence that the price of oil has anything to do with scarcity at all! And if that is indeed the case, why use violence to make oil ‘accessible’? Let’s examine these two points more closely.
The Ups and Downs of Oil Prices
Consider Figure 1. [4] The top series in the chart, plotted against the left scale, shows the ‘real’ price of crude oil – i.e., the price per barrel denominated in 2013 dollars. Now, recall that, during the early 2000s, the common view was that the attacks of 9/11 had given the U.S.-led coalition the pretext to dismantle, or at least incapacitate, OPEC. The Economist of London expressed this hope quite openly. ‘[K]nocking out Mr Hussein’, the magazine predicted, ‘would kill two birds with one stone: a dangerous dictator would be gone, and with him would go the cartel that for years has manipulated prices, engineered embargoes and otherwise harmed consumers’ (Anonymous 2002).
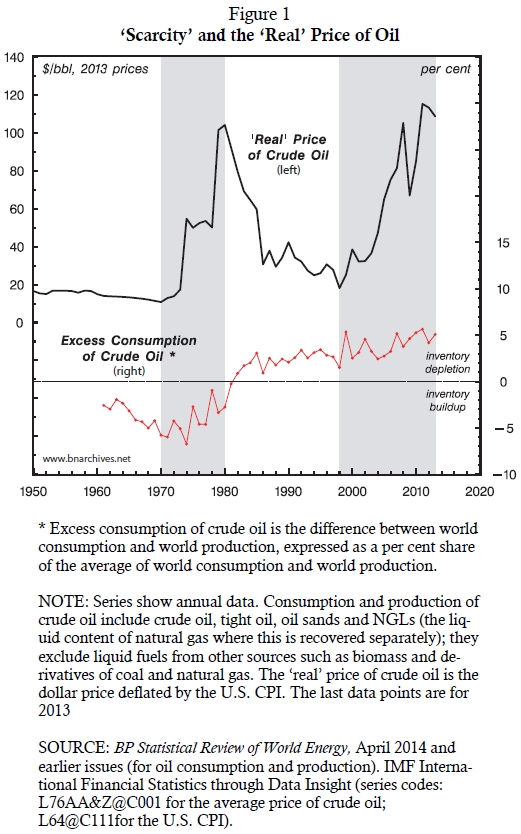
Judging by Figure 1, though, this prediction failed miserably. The invasions and subsequent occupations of Afghanistan and Iraq have done little to keep oil prices down. Instead, they propped them up, massively. ‘Not only has the use of force to procure Iraqi oil failed to achieve its intended results’, lamented Michael Klare (2005), ‘it has actually made the situation worse’. A barrel of crude oil, which in 2000 cost a mere a $20 (in 2013 prices), sold in 2013 for nearly $120. If the price of oil is indeed determined by scarcity, it seems that external interventions during this period have made oil not more abundant, but scarcer.
The Scarcity Puzzle
This last claim, though, is not easy to ascertain. The difficulty is twofold. First, scarcity and abundance denote the difference between ‘demand’ and ‘supply’ – i.e., between the desires of buyers and sellers. Economists, however, know nothing about these desires and therefore use actual consumption and production in their stead (for more on this issue, see the Appendix at the end of the paper). Second, estimates of global oil consumption and production are notoriously inaccurate, so even if the actual purchase and sale of oil were equal to its demand and supply, their measurements would still leave much to be desired.
Now, these problems could be forgiven and forgotten if the empirical data, however imperfect, were congruent with the theory. But they are not. Judging by Figure 1, the ‘real’ price of oil has little or nothing to do with its approximated scarcity.
The bottom series in Figure 1 is the conventional proxy for the scarcity of oil. This proxy is computed by subtracting global oil production from global oil consumption and expressing the result as a per cent share of the average of these two magnitudes. Assuming that consumption is equal to demand and production to supply, positive observations on the chart represent excess demand (inventory depletion), while negative observations denote excess supply (inventory build-up).
According to Economics 101, excess demand should cause ‘real’ prices to increase, while excess supply should cause them to fall. In line with this logic, we divided the period between 1960 and 2013 into four sub-periods, depending on whether the ‘real’ price of oil was heading up or down. In two of the periods – 1970-1980 and 1998-2003, which we shade for easy identification – prices trended upward, while in the other two – 1961-1970 and 1980-1998 – they moved downward. Now, for the theory to be valid, periods of falling prices should be associated with excess supply (i.e., with inventory build-ups indicated by negative readings for the series); similarly, periods of rising prices should be associated with excess demand (inventory depletion, or positive readings).
But that is not what we see in Figure 1. Taking the data at face value, the chart shows that oil was in ‘excess supply’ till 1980. This condition is consistent with falling prices till 1970, but it is inconsistent with rising prices from 1970 to 1980. Similarly with the period from 1980 onward, which the data suggest was one of ‘excess demand’. This condition is consistent with the price uptrend since 1998, but inconsistent with its downtrend between 1980 and 1998. In other words, scarcity per se – at least as conventionally measured by the consumption‑production gap – can tell us very little about ‘real’ price movements (see Box 1).
‘Because’ and ‘Despite’ in the Oil Market
Substituting physical shortages and material surpluses for excess demand and supply is a treacherous strategy, particularly for those trying to predict the price of oil. The following news headlines, collected at random between 1984 and 2004, suggest that such predictions are often not much better than tossing a coin. The headlines are arranged in pairs, with the first entry being consistent with the theory (the price changes ‘because’) and the second inconsistent (the price changes ‘despite’).
Oil prices rise amid reports Iraq jets attacked operations at Iran terminal
Michael Siconolfi, Wall Street Journal, August 13, 1986, p. 1
World oil prices fall despite Iran-Iraq war
Chronicle - Herald Halifax, July 7, 1984, p. 13
Oil prices soar on OPEC pact to cut output
Michael Siconolfi, Wall Street Journal, August 6, 1986, p 1
Oil price falls despite cut in output
Paul Solman, Financial Times, June 13, 1998, p. 12
OPEC agreement means oil prices likely to increase
The Gazette Montreal, June 29, 1987, p. B5
Oil prices fall despite OPEC agreement
Gary Mead, Financial Times, June 25, 1998, p. 32
Oil prices fall again in response to Bush’s hope for Mideast accord and signs of ample supplies
James Tanner, Wall Street Journal, October 3, 1990, p. C14
Oil price rises despite ample supply
Calgary Herald, December 8, 1995, p. C13
Oil prices slide in anticipation of rise in output
Marie C. Sanchez. Wall Street Journal, October 30, 2000, p. 1
Oil prices soar despite rise in output
Toronto Star, September 12, 2000, p. D3
Oil prices fall on rising US stockpile
Adrienne Roberts, Financial Times, June 28, 2001, p. 15
Crude markets unfazed by OPEC; oil prices rise despite stock build
Octane Week Potomac, June 26, 2000, Vol. 15, No. 26, p. 1
Oil prices rise as OPEC output cut nears
Robert DiNardo, John Kingston, Anita Nugraha and Margaret McQuaile, Platt’s Oilgram News, March 5, 2004, Vol. 82, No. 43, p. 1
Oil prices fall despite OPEC output cut
EIU Viewswire, March 31, 2004
One could of course claim that, with the rising threat of Peak Oil, short-term variations of production and consumption, particularly since the early 2000s, have become less important for the price of oil. The problem with this argument is that the finality of oil and the bell shape of its temporal production had already been recognized in the 1950s, yet the price of oil, instead of rising continuously since this recognition, has fluctuated heavily. [5] As Figure 1 shows, measured relative to the U.S. CPI, oil prices increased more than tenfold in the 1970s, fell by more than 80 per cent till the late 1990s, and rose sixfold since then.
All in all, then, the conventional scarcity link between capital accumulation and Middle East conflict remains unsubstantiated. Not only has outside intervention in the region been associated with rising as well as falling prices, but these price oscillations seem unrelated to the material short- and long-term underpinnings of the oil sector.
Does this record mean that Middle East conflicts are largely unrelated to the scarcity and price of oil, and therefore to the accumulation of capital? Could it be that conflict in the region is mostly cultural, political or international in nature and has little or nothing to do with capitalism as such? Should we abandon the holy trinity of demand-supply-equilibrium and examine this question from a different angle altogether, or is oil simply the exception to the otherwise eternal laws of neoclassical economics?
3. From Absolute Accumulation to Differential Accumulation
The answer starts with capital. [6] As noted, the conventional creed, both mainstream and heterodox, sees capital as an ‘economic’ entity. This entity is said to exist as an amalgam of ‘real’ productive items such as machines, structures, semi-finished goods, inventories, raw materials and, in the opinion of many, also knowledge. Now, according to the economists, this ‘real’ amalgam has a unique absolute magnitude, enumerated in universal quantities of consumption and production: it can be measured either in ‘utils’ (units of utility), which are the elementary particles of mainstream economics, or in socially necessary abstract labour time, which is the elementary particle of Marxism. In principle, this framework should enable us to look at the ‘capital stock’ of ExxonMobil and conclude that it has a util-generating capacity of 5 trillion (say), or that its magnitude is equivalent to the 10 billion socially necessary abstract labour hours it would take to reproduce.
Unfortunately, this ‘economic’ view of capital, although all-prevalent in theory, is largely useless in practice. First, utils and socially necessary abstract labour time are impossible to observe, let alone measure (and they might be logically inconsistent to start with). This inability means that the ‘real capital’ of individual firms such as ExxonMobil cannot be quantified, and therefore that the aggregate ‘capital stock’, which national statisticians labour so hard to amalgamate, has no clear meaning. Second, and perhaps more pertinently for our purpose here, ‘real’ accumulation, however measured, is pretty much irrelevant in modern capitalism.
Capital as Power and Differential Accumulation
In our day and age, capitalists and corporations are conditioned and driven not to maximize their ‘real’ profits, but to beat the average and exceed the normal rate of return. They seek not to perform, but to outperform; to obtain not absolute accumulation, but differential accumulation. For ExxonMobil, a 10 per cent rate of return is a mark of failure if the global average is 20 per cent; but a –5 per cent return (i.e., an outright loss) is deemed a huge success if the average return is an even bigger loss of –15 per cent.
This differential drive is no fluke. Capital, we argue, is not a productive economic entity, but a quantitative measure of organized power. And since power relations are inherently relative, capital, which denotes the quantity of organized power, must be assessed differentially.
Take ExxonMobil again. In 2013, the company’s net profit stood at $32.6 – a figure 15.8 times larger than the net profit earned by the typical Fortune 500 firm ($2.2 billion) and 103,578 times larger than the net profit of the average U.S. corporation ($308,945). [7] These differentials quantify the complete spectrum of power processes that, together, define the capitalized entity we call ExxonMobil. They reflect the power politics and wars of the Middle East in which ExxonMobil is deeply embedded; the conflictual relations ExxonMobil has with its buyers, suppliers and workers; the company’s struggles and collaborations with governments through concessions, taxation, subsidies, energy-related policies, intelligence services and bribes, among other links; its power alliances and feuds with other integrated oil companies as well as with the energy sector more broadly; its divergences and convergences with different corporate coalitions across the business universe; its tenuous engagement with science over issues of Peak Oil, pollution and climate change; the list goes on.
Every dollar of ExxonMobil profit is impregnated with these power relations – and nothing but these power relations – and the same holds true for every other corporation (and, indeed, for every income-earning entity). And since differential corporate profits quantify relative corporate power, the differential market value of corporations – which discounts expected profits into present asset prices – is in fact nothing but the capitalization of power.
Now, in order to sustain and augment their relative profit and capitalization, corporations need to engage in strategic sabotage: they must subvert their opponents as well as society as a whole. [8] They have to keep their rivals at bay, undermine their initiative and thwart their thrust. More broadly, they need to hold society below its full potential, to redirect its activities so that these activities amplify their own distributive share. To achieve their differential goals, corporations are compelled to manipulate threats and leverage violence, to undermine resonance and inflict dissonance, to restrict autonomy and exact obedience. In this sense, their capital is power, and nothing but power. Its differential accumulation symbolizes the ability of the capitalists who own it and the state organs that support it to creorder – or create the order of – the world in their own capitalized image.
The notion of capital as power is fundamentally different from received convention. Economists do not ignore power, of course. But they treat it as if it were external to capital proper. Power, they readily concede, can bolster accumulation (as heterodox political economists repeatedly emphasize), or distort and undermine it (as mainstream economists love to insist). But since capital itself remains a purely economic entity, the impact of power, whether positive or negative, must come from without, by definition.
By contrast, in our framework power is internal to capital. Indeed, it is power relations that define what capital is in the first place, and it is power relations – and the mode of power more generally – that determine how large capital is and how quickly it accumulates. This is why we speak not of capital and power, but of capital as power; not of a juxtaposition, but of a figurative identity. [9] And since power is not a qualitative entity in its own right but a quantitative relationship between entities, the accumulation of capital as power must be measured – as it is indeed measured every day and everywhere – not absolutely, but differentially. [10]
Dominant Capital and Differential Accumulation Regimes
Now, if we think of capital not as a productive economic entity but as the quantification of organized power, and if we measure it not absolutely but differentially, we can no longer treat it as a mere aggregate. We need to examine not only the generalized conflicts capital has with other broad groups in society, such as workers and the unemployed, but also the redistributional struggles within capital itself. We must unpack not only capital’s overall movements relative to other aggregates, but also the constant realignment of its own pecking order.
This is where our notion of ‘dominant capital’ comes to the fore. The term refers to the leading state-backed corporate coalitions at the centre of the process being examined, whether that process takes place in a particular sector, a particular country or region, or the global political economy as whole. [11]
To accumulate differentially, dominant capital needs to beat the relevant average. Analytically, it could do so either by expanding the relative size of its organization measured in terms of employees, or by increasing its profit (and capitalization) per employee. In our work, we call the first process ‘breadth’ and the latter ‘depth’ and argue that, over the past century, breadth has been increasingly achieved not through greenfield investment in new plant and equipment but through mergers and acquisitions, while depth has principally been achieved not through cost-cutting but through inflation in the midst of stagnation, or stagflation. Moreover, research by us and others suggests that, for the political economy as a whole, these two processes tend to develop into increasingly synchronized ‘regimes’ – with the ups and downs in mergers and acquisitions being inversely correlated with the cycles of stagflation. [12]
Note that regimes of differential accumulation are not narrow ‘market’ phenomena, but broad societal transformations. They are driven not by economic growth and price stability, but by corporate amalgamation and redistributive stagflation. Their key feature is not the augmentation of means of production, but the restructuring of power writ large. Over time, they serve to realign the relationships between different groups in society, between these groups and governments and within capital itself. In other words, they are politicized to their very core. And this politicization makes them crucial for our purpose here: they can help us reconceptualise, recontextualize and research the connection between Middle East conflict and the accumulation of capital.
4. The Weapondollar-Petrodollar Coalition
Our study of this connection began in the late 1980s. In 1989, before the dawn of the internet age, we wrote an obscure series of four discussion papers on oil, armaments and the Middle East. [13] The papers showed that, by the early 1970s, the Middle East had become the focus of two important flows – receipts from weapon imports into the region and revenues from oil exports out of it. Underpinning these two flows, we identified the emergence of a formidable, albeit uneasy, global alliance between the integrated oil companies, the large armament contractors, leading Western governments and key oil-producing countries. We called this global alliance the ‘Weapondollar-Petrodollar Coalition’ and set out to explore its nature, history and implications. [14]
The Petro-Core and the Oil-Producing Countries
The interests of the Weapondollar-Petrodollar Coalition, we have argued, converged on high crude-oil prices. For the oil-producing countries, the rationale is straightforward: since the cost of extracting the crude oil changes only gradually, most of the increase in price translates into higher net income (higher prices may reduce the number of barrels sold, but with oil this loss tends to be relatively small).
For the integrated oil companies, the reason is a bit more involved. Crude oil is a major input for the refining operations of those firms, so when its price increases, so does the companies’ cost of production. However, the oil companies do not simply absorb this higher cost while keeping their selling price unchanged. Instead, they usually mark their cost up by a given margin, passing on most of the increase – and sometimes more – to their consumers in the form of a higher price. The effect of this ‘passing on’, though, is anything but neutral. The companies’ profit margin, defined as the ratio of profit to sales, may remain stable; but this very stability ascertains that the absolute dollar level of their profit will grow in line with their higher cost. So for the integrated oil companies, too, higher crude-oil prices generally translate into fatter bottom lines. [15]
The converging performance of these two groups – the integrated oil companies and the oil-producing countries – is illustrated in Figure 2. [16] The chart, expressed in constant 2013 dollars, contrasts the total oil exports of OPEC with the net profit of the ‘Petro-Core’, a name we devised to denote the world’s leading private integrated oil companies. During the early 1960s, this core comprised six firms – British Petroleum, Chevron, Exxon, Mobil, Royal-Dutch/Shell and Texaco. The 1999 merger of Exxon and Mobil into ExxonMobil reduced this number to five, and the 2001 absorption of Texaco by Chevron truncated it further to four (which is the current situation). [17]
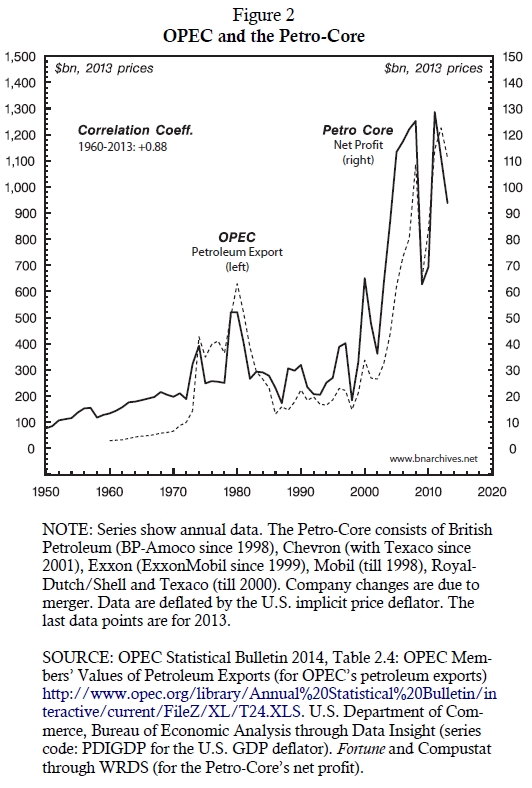
As the chart makes clear, the correlation between the two series is tightly positive (a Pearson coefficient of 0.88 out of a maximum value of 1). This correlation means that whatever determines the income of one group has a similar impact on the earnings of the other – and vice versa. And the most important determinant of oil incomes, at least since the 1970s, has been the price of oil.
It’s All in the Price
The pivotal role of price is depicted in Figure 3. The chart juxtaposes the differential earnings per share (EPS) of the integrated oil companies and the relative price of crude oil (monthly data smoothed as 12-month trailing averages). [18] The differential EPS series (solid line) is the ratio between the average EPS of the world’s listed integrated oil companies and the average EPS of all listed firms in the world. When this ratio goes up – i.e., when the oil companies beat the world average – the result is differential accumulation; when the ratio goes down – that is, when the oil companies trail this average – the result is differential decumulation.
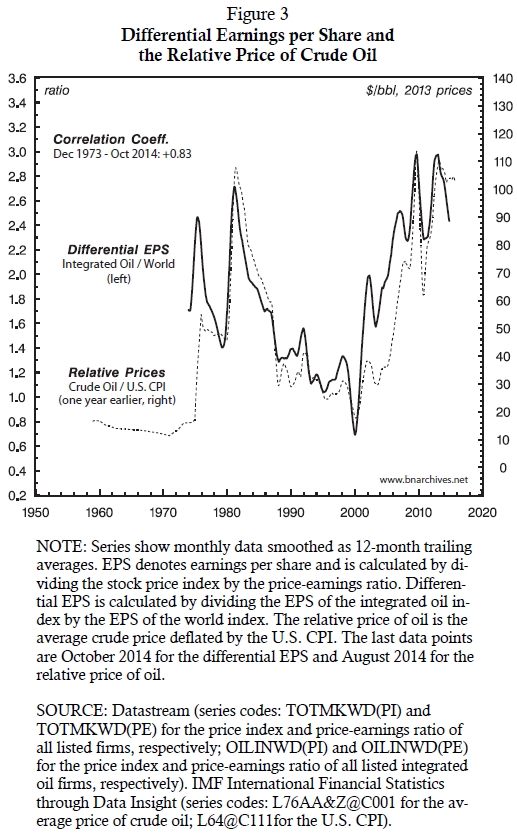
The relative price measure (dashed series) shows the dollar cost of a barrel of crude oil expressed in constant 2013 prices (derived by deflating the current price by the U.S. CPI). A rise in this index means that oil prices increase more quickly (or fall more slowly) than consumer prices, while a drop suggests that they decrease more quickly (or rise more slowly).
Note that the relative price of oil is plotted with a one-year lag, so that current readings on the chart show what this price was 12 months earlier. The reason for this lag is that ‘current’ monthly EPS are not really current; instead, they represent the average of the past four quarters, so the full impact on profit of a change in oil prices is felt only after a year.
The historical picture portrayed by this chart leaves little to the imagination. It shows that, as far as the differential profits of the integrated oil companies are concerned, the key factor, at least since the early 1970s, was and remains the relative price of oil. The high Pearson correlation coefficient between the two series (0.83) means that analysts trying to predict the differential profits of the integrated oil companies don’t need to look very far. They don’t need to project supply and demand, and not even consumption and production. They don’t have to worry about China’s avaricious appetite for energy or the shale-oil boom in the United States. They don’t need to disentangle the web of international relations, and they don’t have to deconstruct culture and religion. All they need to know is the relative price of oil 12 months earlier. And since oil profits go together with the earnings of the oil-producing countries (Figure 2), the same logic applies to OPEC. In short, in the oil sector, profits and incomes are ‘all in the price’. [19]
The Arma-Core
The leading armament contractors – based primarily in the United States, but also in Europe, the Soviet Union (later Russia) and other countries – have also come to benefit from higher oil prices. This benefit first became apparent in the 1970s. The waning of the Vietnam conflict shifted the focus of arms exports from East Asia to the Middle East. During the late 1960s, East Asia absorbed nearly 40 per cent of the world’s arms exports, while the Middle East and North Africa (MENA) accounted for only 15 per cent. By the mid-1970s, though, the situation reversed: the share of East Asia dropped to less than 10 per cent, while that of MENA increased fourfold, to roughly 60 per cent. [20]
The 1970s were lean years for the weapon makers. The end of the Vietnam War and the beginning of Détente caused domestic military budgets to drop sharply. In the United States, the GDP share of military expenditures was cut in half – from 10 per cent in the late 1960s to 5 per cent in the late 1970s. [21] Under these circumstances, a concurrent shrinkage of the export market – where profit margins are typically far higher than in domestic sales – would have spelled disaster for the armament contractors. And that is where the Middle East came to the rescue.
The price of oil, which tripled in inflation-adjusted terms during the early 1970s and again doubled later in the decade (Figure 1), increased the oil revenues of Middle East oil-producing countries many times over (Figure 2). And with their purchasing power rapidly rising, these countries went on a shopping spree. They imported anything and everything foreign, including plenty of weapons. According to our empirical estimates, between 1973 and 1989, every additional $100 of Middle East oil revenues generated $6 of armament imports. [22] In this way, higher oil prices became the lifeline of the ailing armament contractors.
Western Governments, Particularly the U.S.
The position of Western governments on the issue of oil prices has been more complex, and sometimes duplicitous. In public, most politicians have found it expedient to call for ‘cheap’, or at least ‘affordable’ energy, and for good reason. During the 1970s, higher oil prices were blamed for triggering a stagflation crisis that placed their voters between the rock of inflation and the hard place of stagnation. Economists called it a ‘supply shock’, an exogenous ‘distortion’ that rattled the otherwise self-equilibrating market system. And that branding made it easier to put the blame on others. [23]
The usual suspects were the greedy oil sheiks – although there were also other culprits, particularly the unscrupulous labour unions and the capricious sky gods. These ‘actors’, complained the economists, didn’t play by the rules. Instead of simply reacting to ‘market forces’ as the textbooks require, they took an ‘autonomous’ initiative. Acting unilaterally, without provocation and with no justification, they simply increased the price of energy, labour and foodstuffs. Just like that. Worse still, the increases were entirely ‘arbitrary’: they were driven not by technology and desires (read supply and demand), but by power, greed and whim.
Unfortunately, though, there is no such thing as a free lunch. The laws of the market, like those of any organized religion, cannot be violated without repercussion. And since we haven’t managed to prevent the gross violation of these laws, we must all pay the price in the form of generalized stagflation. Given this ‘narrative’, no politician in her right mind would openly call for high oil prices.
But there were other, less publicised sides to these developments. Rising oil prices served the large oil and armament companies, which during the 1970s and 1980s dominated the business universe, particularly in the United States, and whose interests the politicians could not easily ignore. [24] Rising oil prices were also expected to skew the geopolitical balance in favour of the United States and Britain, which had their own oil resources, and against Japan and Continental Europe, which did not. And, last but not least, rising oil prices helped fortify the autocratic regimes of Iran and Saudi Arabia – the ‘twin pillars’ of U.S. policy in the Middle East. Taken together, these considerations may serve to explain the apparently schizophrenic position of the U.S. administration, which, although officially in favour of low energy prices, was instrumental to the 1971 Tripoli and Teheran agreements that solidified OPEC and led to the twelvefold increase in the price of oil. [25]
From Free Flow to Limited Flow
The interest of the Weapondollar-Petrodollar Coalition in high oil prices radically transformed the nature of the oil business. Until the late 1960s, the sector operated on a ‘free-flow’ basis (our term). The main focus was volume. The Petro-Core still owned much of its crude oil, and with prices being relatively low and stable – Figure 1 shows that in the 1950s and 1960s they averaged $10-20 in 2013 dollars – profitability correlated positively with the level of output.
This situation changed completely in the 1970s. The rise of OPEC and the massive nationalization of oil resources deprived the Petro-Core as well as lesser companies of their previous properties in many of the oil-producing regions. They became ‘service providers’ for the oil-producing countries. They extracted, refined and marketed oil and its products, but their ownership of the raw material itself was significantly curtailed. Most importantly, they lost their previous control over prices.
It was the dawn of a new, ‘limited-flow’ regime (our term). Prices in this new regime have become deeply politicized. They were no longer set by the invisible hand of the almighty ‘market’ (i.e., the leading oil companies and the main users of oil). Instead, they were determined, visibly and explicitly, by OPEC, with plenty of intervention and pressure from various governments and international organizations. And the oil itself, rather than flowing ‘freely’, was now fine-tuned by OPEC quotas to fit ‘what the market can bear’. [26]
Initially, the leading oil companies were alarmed by this turn of events. Having occupied the commanding heights of the energy world for much of the twentieth century, they suddenly found themselves demoted to a status of ‘interested bystanders’, as one observer put it (Turner 1983: 147-148). Their apprehension, though, was short-lived. OPEC, they quickly realized, was their manna from heaven. Although no longer in the driver’s seat, they remained indispensable for the cartel’s extraction and transportation, not to speak of its downstream operations and complex business dealings. [27] In return for these services, the companies received something they could not have achieved on their own: a tenfold rise in the inflation-adjusted price of oil and a concomitant jump in their differential profit-read-power (Figure 3).
And so the oil arena shifted from the earlier ‘free flow’ logic of greenfield breadth to the new ‘limited flow’ logic of stagflationary depth. Instead of producing more and more oil to profit from a growing economy, OPEC and the companies concentrated on raising oil prices to profit from the sabotage of inflation and stagnation they inflicted on the rest of the world. This shift was supported by the armament contractors who saw their weapon exports to the Middle East soar, and it was condoned, usually tacitly though occasionally openly, by the U.S. and U.K. governments.
5. Energy Conflicts
Central to this shift was the new institution of ‘energy conflicts’. As noted in Section 2, the common view on the subject is that resource wars – and certainly wars over oil – are fought to make the commodity accessible and cheap, at least for the aggressors. But in the late 1960s and early 1970s, we have argued, there emerged in the oil arena a new form of organized violence: the energy conflict. This type of conflict serves not the end users of oil, but its owners, sellers and associated allies; and it does so not by cheapening oil, but by making it more expensive.
As we have seen in Figure 1, the price of oil has little to do with the commodity’s actual scarcity, however estimated. But it has plenty to do with its perceived scarcity. In the modern world of capital, accumulation is forward-looking. The capitalization ritual compels investors to look not to the past, but to the future: to fantasize alternative scenarios, assess their likely effect on oil, and discount these effects, weighted by their respective ‘risk coefficients’, into current prices. [28] And from the late 1960s onward, the most important scenario for the price of oil has been conflict in the Middle East.
We should note, though, that however important and central, the price of oil here is merely a means to an end. The end itself is profit – and more precisely, differential profit – and it is this magnitude we now turn to examine.
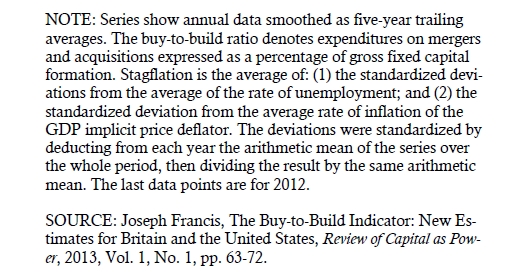
The historical link between energy conflicts and differential profits is demonstrated in Figure 4. [29] The chart shows the differential return on equity of the Petro-Core. This measure is computed in two steps: first, by subtracting the return on equity of the Fortune 500 group of companies from the return on equity of the Petro-Core; and second, by expressing the resulting difference as a per cent of the Fortune 500’s return on equity. Positive readings (grey bars) indicate differential accumulation: they measure the extent to which the Petro-Core beats the Fortune 500 average. Negative readings (black bars) show differential decumulation: they tell us by how much the Petro-Core trails this average.
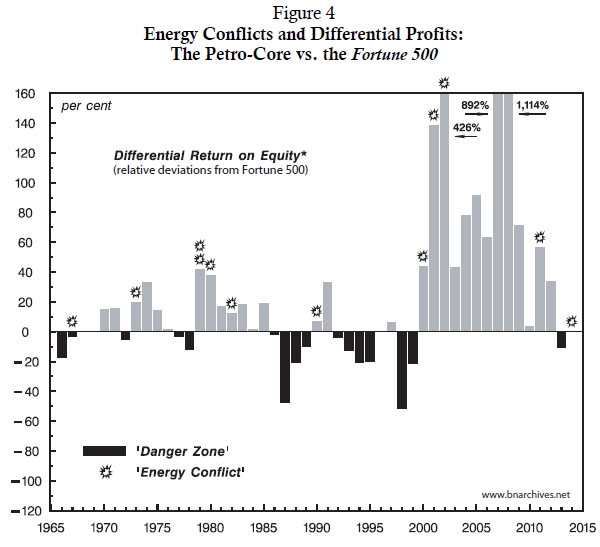
A stretch of differential decumulation constitutes a ‘danger zone’ – i.e., a period during which an energy conflict is likely to erupt in the Middle East. The actual breakout of a conflict is marked by an explosion sign. The individual conflicts are listed in the note underneath the chart.
The Stylized Patterns
The figure shows three stylized patterns that have remained practically unchanged for the past half‑century:
• First, and most importantly, every energy conflict save one was preceded by the Petro‑Core trailing the average. In other words, for a Middle East energy conflict to erupt, the leading oil companies first have to differentially decumulate. [30] The only exception to this rule is the 2011 burst of the Arab Spring and the subsequent blooming of ‘outsourced wars’ (our term for the ongoing fighting in Lebanon‑Syria‑Iraq, which is financed and supported by a multitude of governments and organizations in and outside the region). This round erupted without prior differential decumulation – although the Petro‑Core was very close to falling below the average. In 2010, its differential return on equity dropped to a mere 3.3 per cent, down from 71.5 per cent in 2009 and a whopping 1,114 per cent in 2008.
• Second, every energy conflict was followed by the oil companies beating the average. In other words, war and conflict in the region – processes that are customarily blamed for rattling, distorting and undermining the aggregate economy – have served the differential interest of the large oil companies at the expense of leading non‑oil firms. [31] This finding, although striking, should not surprise our reader. As we have seen, differential oil profits are intimately correlated with the relative price of oil (Figure 3); the relative price of oil in turn is highly responsive to Middle East ‘risk’ perceptions, real or imaginary; these risk perceptions tend to jump in preparation for and during armed conflict; and as the risks mount, they raise the relative price of oil and therefore the differential accumulation of the oil companies.
• Third and finally, with one exception, in 1996‑97, the Petro‑Core never managed to beat the average without there first being an energy conflict in the region. [32] In other words, the differential performance of the oil companies depended not on production, but on the most extreme form of sabotage: war. [33]
Another Angle
How robust are these conclusions? Are they sensitive to the particular measure of differential profit being used? Will they still hold if we use a different proxy?
Figure 5 tries to assess these questions. Here the focus is on the world as a whole, and the measure for profit is earnings per share (EPS). The top two series contrast the average EPS performance of the world’s listed integrated oil companies with the average EPS performance of all of the world’s listed companies. Each series measures the annual rate of change of the respective EPS, computed by comparing any given month with the same month a year earlier and expressed as a three-year trailing average.
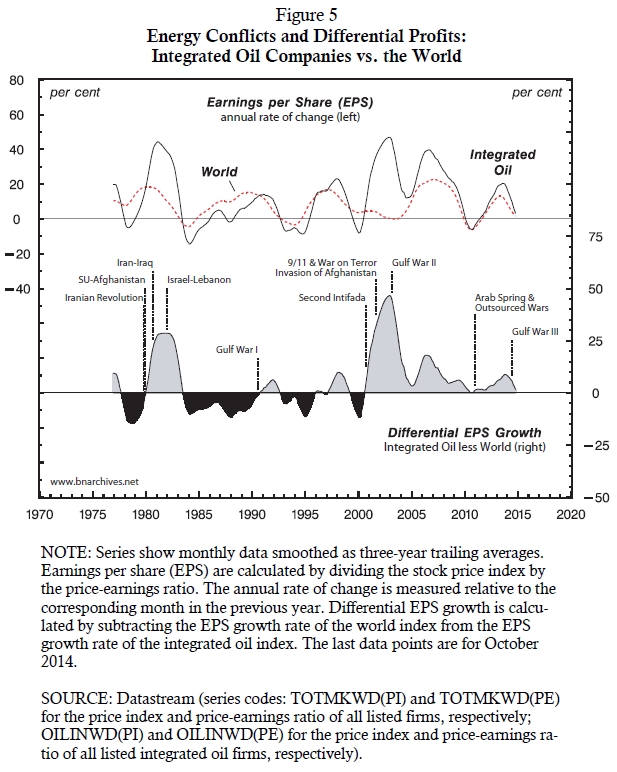
The bottom series shows the differential EPS growth of the integrated oil companies. This series is derived by subtracting the EPS growth rates of the world index from the EPS growth rate of the integrated oil index and expressing the result as a three-year trailing average. As in Figure 4, grey areas indicate periods during which the integrated oil companies beat the average (differential accumulation), while black areas show periods in which they trail the average (differential decumulation).
Now, note that, while the energy conflicts here are the same as those listed in Figure 4, the measure of differential profit is different in several important respects. (1) The geographical scope is much wider and the focus is less on corporate size and more on the nature of business activity. Whereas in Figure 4, the comparison is between a Petro-Core of four to six firms and the U.S.-based Fortune 500, here the comparison is between all of the world’s listed integrated oil companies and the world average for all listed companies. (2) The profit metric is different. Whereas in Figure 4, the proxy of choice is return to equity, here it is earnings per share (EPS). (3) The nature of the variables is different. While in Figure 4 we look at levels, here we examine rates of change. (4) The temporality is more refined. Whereas in Figure 4 the data are annual, here they are monthly, expressed as a three-year trailing average. (5) The comparison of the two indices is different. In Figure 4, the difference between the two profit measures is expressed as a per cent of the benchmark measure, whereas here it is presented in absolute terms. And (6), the period under examination is shorter – in Figure 4 it starts in 1966, while here the data begin only in 1973 (1976 for the three-year trailing averages).
All in all, then, our proxy for differential profits in Figure 5 is very different from the one we use in Figure 4. Yet the stylized patterns – as well as the exceptions to these patters – are almost exactly the same!
Similarly to Figure 4, the chart shows that, since 1976: (1) all energy conflicts were preceded by the world’s integrated oil companies suffering differential decumulation (with the exception of the 2011 Arab Spring / outsourced wars and the 2014 third Gulf War, when differential accumulation was very close to zero, but still positive); (2) all conflicts were followed by the integrated oil companies shifting to differential accumulation; and (3) except for the mid-1990s, the integrated oil companies have never managed to beat the average without a prior energy conflict. [34]
6. The Universal Logic
These stylized patterns appear almost too simple, not to say simplistic – particularly when compared to sophisticated explanations of Middle East wars. And maybe this is their beauty.
The experts on this subject – whether conservative or radical, Marxist or postist, materialist or culturalist, international relationsist or regional punditist – are undoubtedly right. The Middle East defies any simple logic – or at least that’s what the rulers want us to think. No determinism can account for its cultural subtleties, no structural theory can explain its multilayered conflicts, no Eurocentric text can decipher its poststructural discourses. It is simply special.
And yet, somehow, this kaleidoscope of complex specificities gets enfolded, figuratively speaking, into the universal logic of modern capitalism: the differential accumulation of capital. [35] In the Middle East, we have argued, this process revolves around oil profits:
Obviously, the flow of arms to the region [and its associated conflicts] is anchored not in one particular cause but in the convergence of many: internal tensions [such as those leading to the Arab Spring], inter‑state confrontations [for example, the 1980‑88 Iraq‑Iran War], conflicts between coalitions of countries [the first, second and third Gulf Wars], superpower intervention [a permanent feature], radical and anti‑radical ideologies [the 1979 Iranian revolution, ISIS, etc.], nationalism [the Palestinian intifadas], clericalism [Iran, Egypt, Afghanistan, etc.], economic turbulence and business cycles [the unsatiated capitalist thirst for ‘cheap energy’]. . . . Yet, one way or another, these processes can be seen as already engulfed by and absorbed into the massive flow of the biggest prize of all: oil profits. (Nitzan and Bichler 2007: 376, translated from the Hebrew)
Our analysis of this process has focused on the Weapondollar‑Petrodollar Coalition of the largest armament contractors and integrated oil companies, OPEC and various branches of Western governments. All members of the coalition, we’ve argued, share an interest in regional tensions. But when it comes to open hostilities and war, the balance tends to hang on the oil companies:
The large oil companies and the leading arms makers both gained from Middle East ‘energy conflicts’ – the first through higher conflict premiums and the latter via larger military orders. But beyond this common interest the position of these groups differed in certain important respects. . . . Overall, ‘energy conflicts’ tended to boost arms exports both in the short‑run and long-run, and given that the weapon makers have had an open‑ended interest in such sales . . . their support for these conflicts should have been more or less unqualified. For the Petro‑Core, however, the calculations are probably more subtle. . . . [T]he effects on their profits of higher war‑premiums would be positive only up to a certain point. Furthermore, the outcome of regional conflicts is not entirely predictable and carries the inherent danger of undermining their intricate relations with host governments. For these reasons, we should expect the large oil companies to have a more qualified view on the desirability of open Middle‑East hostilities. Specifically, as long as their financial performance is deemed satisfactory, the Petro‑Core members would prefer the status quo of tension‑without-war. When their profits wither, however, the companies’ outlook is bound to become more hawkish, seeking to boost income via a conflict‑driven ‘energy crisis’. (Nitzan and Bichler 1995: 497)
Unfortunately for most subjects of the Middle East – and for the vast majority of the world population – the empirical regularities of energy conflicts and differential profits we have teased out of this hypothesis remain as true today as they were in the early 1970s.
Looking
backward, these
regularities helped us explain the history of the process till the late 1980s.
Looking forward, they allowed us to predict, in writing and before the event,
the 1990‑91 first Gulf War as well as the 2001
invasion of Afghanistan and the 2002 onset of the second Gulf War. [36]
We have not predicted the recent spate of energy conflicts – but only because our research over the past decade has carried us away from the Middle East. The logic of our argument, though, remains intact. As Figures 4 and 5 show, any researcher who would have updated our data could have predicted, ahead of time, the 2011 Arab Spring and its associated outsourced wars, as well as the 2014 third Gulf War against ISIS.
7. The Broader Vista
The Middle East dramas, though, are themselves part of a bigger story. So far, we have shown that these dramas – the conflicts and wars, the oil crises and inflicted ‘scarcities’, OPEC’s machinations and outside interventions, terrorism and nationalism, religion and culture – could be enfolded into the stylized link between energy conflicts and differential oil profits. But there is an even broader enfoldment to consider: the way in which this oil link fits the larger picture of global accumulation. Needless to say, this latter enfoldment is not easy to articulate, certainly not on the fly, so our outline below should be read as tentative and suggestive rather than definitive and exhaustive.
Reversals of Fortune
Begin with a bird’s-eye view of the differential oil profits and the energy conflicts depicted in Figures 4 and 5. The history of this process can be divided into three rough periods:
1. Late 1960s – early 1980s. During this period, the oil companies tended to beat the average. There were only a few ‘danger zones’, and each zone was promptly followed by an energy conflict – or a string of conflicts – causing differential profits to quickly flip back into positive territory.
2. Mid 1980s – late 1990s. During this period, the oil companies tended to trail the average. With the exception of one energy conflict (the first Gulf War), ‘danger zones’ lingered with no relief in sight, causing the oil companies to suffer from protracted differential decumulation.
3. Early 2000s – present. In this period, the oil companies have again taken the lead. Their differential profits have risen to record highs, having been boosted by frequent energy conflicts that seem to erupt at the mere suggestion of differential decumulation.
Breadth and Depth
Now, as noted in Section 3 above, dominant capital as a whole tends to oscillate between two main regimes of differential accumulation: breadth and depth. Breadth is driven largely by mergers and acquisitions, while depth is fuelled mostly by stagflation. And what is remarkable for our purpose here is that, since the late 1960s, these regimes seem to coincide with the ebb and flow of energy conflicts and differential oil profits.
Figure 6 shows the long-term movements of corporate amalgamation and stagflation in both the United States and the United Kingdom. Amalgamation is proxied by the ‘buy-to-build’ ratio, plotted against the left log scale. This ratio measures the magnitude of mergers and acquisitions expressed as a per cent of gross fixed capital formation (the first magnitude denotes the money spent on buying existing assets, while the second measures the money spent on building new assets, so dividing the former by the latter yields the ‘buy-to-build’ ratio). [37]
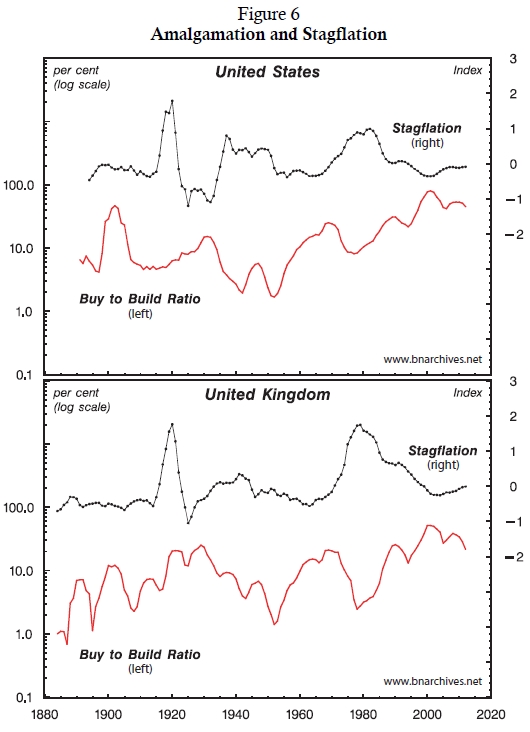
Stagflation, plotted against the right scale, is a synthetic index. It averages the standardized deviations of unemployment and inflation from their respective historical means. The average value of this index for the whole period is zero, by definition. Positive values indicate above-average stagflation, while negative values represent below-average stagflation. [38]
Figure 6 shows that, since the 1920s, in both the United States and the United Kingdom, corporate amalgamation and stagflation have tended to move counter-cyclically: when one measure rises, the other recedes, and vice versa. Moreover, the counter-cyclical patterns in the two countries are remarkably similar. [39]
Although research on this topic is still in its infancy, the remarkable similarities between these two leading political economies suggest that breadth and depth regimes might be a fairly universal – and perhaps increasingly synchronized – phenomenon in modern capitalism. [40] And insofar as this phenomenon is increasingly universal, it might serve to explain the larger role of energy conflicts and differential oil profits.
Energy Conflicts and Stagflation
As we can see in Figure 6, merger activity peaked around the late 1960s before tipping into a free fall that lasted till the early 1980s. This retreat from amalgamation forced dominant capital to rely on rising stagflation, and the main engines of this stagflation were tensions and energy conflicts in the Middle East.
The crucial link in this process was provided by oil prices. Like many capitalist phenomena, broad-based inflation (read stagflation) often requires a trigger, and during the period in question this trigger was rising oil prices. The connection between oil prices and inflation is illustrated in Figure 7. The chart juxtaposes the ‘real’ price of crude oil on the left scale and the rate of consumer price inflation in the advanced countries on the right (monthly data smoothed as 12-month trailing averages). It also identifies three distinct periods, based on the changing correlation between the two series.
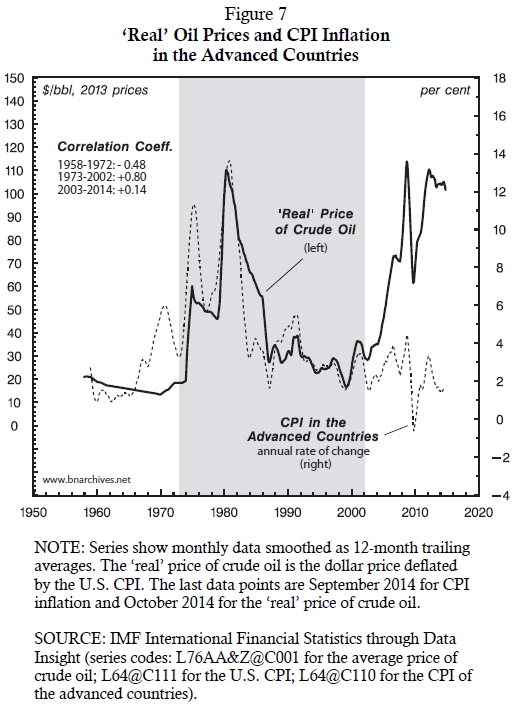
Until the early 1970s, the correlation was largely negative. Inflation fell and rose, but its fluctuations must have been driven by something other than the ‘real’ price of oil, which remained relatively stable. This indifference ended in 1973. From 1973 to 2002, the two series were tightly and positively correlated (Pearson coefficient of 0.8). During the 1970s, the ‘real’ price of oil soared and inflation rose sharply with it. And when ‘real’ oil prices collapsed in the 1980s and continued to fall through much of the 1990s, inflation decelerated in much the same way. During the most recent period, from the early 2000s to the present, this positive correlation loosened considerably; but then, that already puts us ahead of our story.
8. Middle East Energy Conflicts and Differential Accumulation Cycles
With this link in mind, we can now begin to connect the specific patterns of Middle East energy conflicts with the broader differential accumulation cycles of depth and breadth.
The Rise of Stagflation (late 1960s – early 1980s)
During the late 1960s, dominant capital in the advanced countries started to shift from breadth to depth (Figure 6). By the early 1970s, the merger wave was receding rapidly, and as amalgamation weakened, stagflation picked up. The main trigger for the latter process was the build-up of Middle East tensions and the eruption of energy conflicts (Figures 4 and 5). Tension and war fuelled the differential profits of the oil companies. And in the absence of amalgamation, these conflicts, which stalked overall inflation in the midst of stagnation (Figure 6), also helped dominant capital as a whole beat the overall average.
The convergence of these power processes during the 1970s and early 1980s gave an enormous boost to the Weapondollar-Petrodollar Coalition. The oil companies and the armament contractors, OPEC and key elements of Western governments – and now also dominant capital more broadly – all had an interest in rising oil prices. Under these circumstances, it is perhaps not surprising that energy conflicts were so frequent and that the differential profits of the oil companies were rarely allowed to fall into negative territory.
The Resurgence of Amalgamation (mid 1980s – late 1990s)
The 1980s brought a sharp reversal. Neoliberalism was in full swing, and with communism soon to disintegrate, the entire world was opening up for dominant capital. Merger and acquisition activity was now going global and by the early 1990s was already testing new records (Figure 6). The flip side was that dominant capital now lost all of its previous appetite for stagflation (Figure 6). Economic growth appeared to have resumed and inflation dropped sharply.
At this point, the Weapondollar-Petrodollar Coalition went out of favour. Although the coalition itself was still interested in high oil prices, the rest of dominant capital wasn’t. This cleavage within the ruling classes reflected on the Middle East. In contrast to the previous stagflationary period, energy conflicts were now few and far between, and the differential profits of the oil companies seemed stuck in negative territory with no sign of reversal (Figures 4 and 5).
Systemic Crisis (early 2000s – present)
The early 2000s were marked by the rising threat of systemic crisis. [41] For the first time since the Great Depression of the 1930s, dominant capital, particularly in the advanced capitalist countries, seems to have confronted the asymptotes of its power. [42] At the household level, the income and asset shares of the top segments of society are now approaching record levels. At the aggregate level, the share of net profit in national income is reaching historical highs. And at the corporate level, the leading firms have grown so much that their profits and capitalization are now many thousands of time bigger than those of the average firm. [43] These distributional gains attest to the peak power of capitalists in general and dominant capital in particular. But they also indicate that extending this power – or simply sustaining it – is becoming more and more difficult.
One symptom of this difficulty is the deceleration of corporate amalgamation. Compared to its 2000 record, the buy-to-build ratio is now one-third lower in the United States and nearly two-thirds lower in the United Kingdom (Figure 6). Like in the 1970s, dominant capital has reacted to this deceleration by trying to switch gears from amalgamation to inflation (i.e. stagflation). [44] But this time it isn’t alone. In the 1970s, small and medium-sized firms were hostile to inflation, as were policymakers. Not anymore. Nowadays, capitalists and policymakers are scared of deflation, and for good reason. Given the asymptotic outlook for further pro-capitalist redistribution, equity and debt prices seem increasingly ‘overcapitalized’ relative to their expected earnings and underlying national incomes, and the last thing overcapitalized assets can withstand is a significant bout of deflation. The net result is that, unlike in the 1970s, the present pro-inflation coalition is much more broadly based. It encompasses not only the Weapondollar-Petrodollar Coalition and dominant capital as a whole, but also many governments and the multitude of medium and small capitalists who all yearn for some ‘healthy’ inflation to ease their deflationary fears.
This constellation seems consistent with the new flare-up of Middle East energy conflicts. With so much hanging on higher inflation, and given the historical role of oil prices as the ‘spark’ that sets inflation going, it is obvious that tension and war in the region would be more than welcome by everyone who stands to benefit from such inflation. And since the interested parties comprise some of the most powerful groups in the world, it shouldn’t surprise us to see the oil companies again flying high and the region once more erupting in flames (Figures 4 and 5).
9. An Omen?
But there is a big fly in the ointment. As Figure 7 shows, over the past ten years or so, the positive link between oil prices and overall inflation seems to have weakened considerably. Between 2003 and 2014, the Pearson correlation coefficient of the two series fell to a feeble 0.14. The short-term movements are still in the same direction, so upticks in the ‘real’ price of oil are closely matched by upticks in inflation; but the long-term trends are clearly opposite: while ‘real’ oil prices have moved upward, inflation has slid. [45] In other words, if conflict-driven oil prices are to reignite worldwide inflation, they would have to rise to levels far beyond their recent record.
This simple observation could prove ominous for the Middle East and the world more generally. In 1956, the Japanese political economist Shigeto Tsuru (1956) examined the role of U.S. military spending as an ‘offset to savings’, a way of absorbing the country’s rising ‘surplus’. Military expenditures, he observed, already amounted to 10 per cent of GDP, and if that level were necessary for economic prosperity, he continued, in ten years’ time the United States would have a defence budget far too large for peacetime: ‘We must say (and we should like to say for the sake of world peace) that it is rather questionable if the United States can spend on defense as much as 16 billion dollars more than today in 1968’ (p. 28). Given that in 1966, exactly ten years later, the United States was deeply entangled in the Vietnam War, this must have been one of the most brilliant if sombre predictions in the social sciences.
The present divergence between ‘real’ oil prices and inflation depicted in Figure 7 may constitute a similar omen. The third Gulf War with ISIS might be the beginning of a new round of Middle East energy conflicts. But that is just the first step. In the past, energy conflicts have led to higher ‘real’ oil prices, which in turn boosted differential oil profits, and this second step is yet to happen. In fact, despite the hostilities, oil prices have retreated sharply from their 2013 record. [46]
There is of course no inherent reason why the stylized patterns presented in this paper must continue to hold in the future. But if they do – in other words, if the world continues to flirt with deflation and the Petro-Core with differential decumulation, and if rising oil prices remain crucial for boosting overall inflation and the oil companies’ differential accumulation – violence and conflict in the Middle East might need to intensify significantly in the years to come.
Appendix: What Do Economists Know about Scarcity?
According to standard economic theory, commodities are not ‘scarce’ or ‘abundant’ as such. [47] They are scarce or abundant in relation to the ‘desires’ of sellers and buyers. When the desire to buy at a given price (i.e., the ‘quantity demanded’) exceeds the desire to sell at that price (‘quantity supplied’), economists denote the difference as ‘excess demand’. If the opposite situation prevails, they call it ‘excess supply’.
For example, if the price of oil is $100/barrel, and if at that price buyers around the world wish to buy a total of 80 million barrels/day while sellers want to sell only 75 million, the result is an ‘excess demand’ of 5 million barrels/day. This positive difference means that, given the price of oil and the prevailing preferences of buyers and sellers, oil is ‘scarce’. However, if the desires were different – for example, if at $100/barrel buyers wanted to buy only 80 million barrels/day while sellers wished to sell 82 million – we would have an ‘excess supply’ of 2 million barrels/day. In this situation, oil would be deemed ‘abundant’. Moreover, different prices imply different desires to sell and buy, making the same commodity scarcer or more abundant, as the case may be.
Now, economists manipulate these magnitudes with great ease – but only conceptually. When it comes to empirical analysis, their hands are tied. And they are tied by the embarrassingly simple fact that they know nothing about the actual desires of sellers and buyers. Needless to say, this ignorance is fatal. It makes it impossible for economists to measure the levels of demand and supply, let alone which exceeds which and by how much. And as long as they don’t know whether the commodity – be it oil, automobiles, software or anything else – is in excess supply or excess demand, they have no clue as to whether it is scarce or abundant.
Interestingly, most economists seem undeterred by this ignorance. In their everyday analyses, they simply assume that ‘what we see is what we get’; or, in economically correct lingo, that the quantities that agents buy and sell are equal to – and therefore ‘reveal’ – their underlying preferences. [48] In practical terms, this assumption allows analysts to measure production as if it were supply and consumption as if it were demand. [49] And since the observed levels of consumption and production are presumed equal to the (unknown) desires of buyers and sellers, the difference between those levels – which to the naked eye appears as a shortfall or build-up of inventories – is equated with excess demand (scarcity) or excess supply (abundance), respectively. [50]
Endnotes
[1] Shimshon Bichler teaches political economy at colleges and universities in Israel. Jonathan Nitzan teaches political economy at York University in Canada. All of their publications are available for free on The Bichler & Nitzan Archives (http://bnarchives.net). Research for this article was partly supported by the SSHRC. The paper is licenced under Creative Commons (Attribution-NonCommercial-NoDerivs 2.5 Canada).
[2] We enclose the terms ‘real’ and ‘productive’ in inverted commas to note that, in our view, these notions are fraught with conceptual and empirical difficulties. For more on these difficulties, see Nitzan and Bichler (2009a: Chs. 5-8).
[3] For a succinct account of this conventional belief, see Nitzan and Bichler (2003).
[4] The earliest version of this figure was presented and examined in Nitzan and Bichler (1995: 487-492).
[5] The concept of Peak Oil is due to the pioneering work of King Hubbert (1956).
[6] The issues discussed in Section 3 are developed more fully in Nitzan and Bichler (2009a), Bichler and Nitzan (2012b), Bichler, Nitzan and Di Muzio (2012), and Bichler, Nitzan and Dutkiewicz (2013).
[7] Data are from Compustat through WRDS, Fortune 500, the U.S. Department of Commerce through Global Insight and the U.S. IRS.
[8] The notion of ‘strategic sabotage’ and its central role in capital accumulation were first articulated by Thorsten Veblen (1904, 1923).
[9] Note that while all capital is power, not all power is capital. Although capital has become socially central and ever more encompassing, conceptually it remains one of many forms of power in society.
[10] The conception of power or force as a quantitative relationship between entities rather than a stand-alone qualitative entity was first proposed and articulated in 1600 by Johannes Kepler (Jammer 1957).
[11] For studies of dominant capital in particular sectors, see for example Baines (2013a, 2013b, 2014) on the grain traders, Cochrane (forthcoming PhD dissertation) on the De Beers cartel, Hager (2012, 2013a, 2013b) on the ownership of the U.S. national debt, Gagnon (2009) on the pharmaceutical sector, McMahon (2013) on Hollywood and Nitzan and Bichler (Nitzan and Bichler 1995; Bichler and Nitzan 1996) on oil and armaments. For works on particular countries and regions, see Brennan (2012b, 2012a, 2014) on Canada, Park (2013, 2015 forthcoming) on South Korea and Nitzan and Bichler (2002, 2009a) on Israel, the Middle East and the United States. For an examination of the global top 1%, see Di Muzio (2015). For the historical role of corporate and government hierarchies around the world in the growth of energy use, see Fix (2015).
[12] On breadth and depth in the United States, see Nitzan (2001) and (2009a: Ch. 17). On breadth and depth in Israel, see Nitzan and Bichler (2000; 2002: Ch. 4). For a comparison of Britain and the United States (including revised data for the latter), see Francis (2013). On South Korea, see Park (2013, 2015 forthcoming). On Canada, with somewhat different conclusions, see Brennan (2014).
[13] Bichler, Nitzan and Rowley (1989); Nitzan, Rowley and Bichler (1989); Rowley, Bichler and Nitzan (1989); and Bichler, Rowley and Nitzan (1989).
[14] The results of this exploration were first published in two related articles that sought to ‘bring capital accumulation back in’ (Nitzan and Bichler 1995) and ‘put the state in its place’ (Bichler and Nitzan 1996).
[15] Oil profits can be affected adversely by drops in the physical volume of sales and/or by lower profit margins; but a large enough increase in the price of crude oil will tend to overwhelm these negative effects, causing overall profit to rise together with cost. For a detailed discussion, see Nitzan and Bichler (2004: footnote 42, pp. 305-306).
[16] For the first version of this chart, see Nitzan and Bichler (1995: 485, Figure 5).
[17] Note the difference in scale. The two series show that, since 1960, OPEC revenues have been roughly ten times larger than the net profit of the Petro-Core. Much of this difference, though, is the consequence of aggregation: OPEC currently has 12 members, while the Petro-Core consists of four firms. So if instead of comparing aggregate exports with aggregate profit we contrast export revenues per country with net profit per firm, the ratio between them drops to roughly three to one. Furthermore, to make the two earning magnitudes conceptually comparable, we need to deduct from OPEC’s export revenues the direct and indirect cost of producing the oil (including expenditures necessary to sustain authoritarian social regimes) and add to the oil companies’ net profits the corporate taxes appropriated by their respective governments. These adjustments would make the oil earnings of the two entities – the countries and the companies – more or less comparable in size.
[18] Earnings per share are computed by dividing total after-tax earnings by the number of outstanding shares.
[19] This claim applies equally to the global oil and gas sector as a whole. The Pearson correlation between this sector’s EPS and the relative price of oil is 0.85 – practically the same as the one for the integrated oil companies only. The net profit of the entire oil and gas sector is roughly 50 per cent larger than that of the integrated oil companies (based on August 2014 data from Datastream), but the EPS of the two groupings are tightly correlated (Pearson coefficient of 0.97).
[20] See Rowley, Bichler and Nitzan (1989: 11, Table 1).
[21] See Bichler and Nitzan (2004: 319, Figure 16).
[22] Nitzan and Bichler (1995: 493-496). For an earlier rough estimate, see Rowley, Bichler and Nitzan (1989: 31, Figure 9).
[23] For the conventional view on this subject, see for example Blinder (1979), Bruno and Sachs (1985) and Blinder and Rudd (2008).
[24] During that period, the net profit of the oil firms and defence contractors reached 15 per cent of the global total (Bichler and Nitzan 2004, Figure 15, p. 316).
[25] For more on these considerations and the other interests involved, see for example Bichler and Nitzan (1996) and Nitzan and Bichler (2002: 225-228, 247-250).
[26] Or, as Ali Al-Naimi, Saudi Arabia’s Oil Minister put it: ‘The price is determined by the market, what we try to do is to make the market balanced. Today there is disequilibrium between supply and demand. Today we are trying to get the market to the normal equilibrium and the price will take care of itself’ (Hoyos 2006).
[27] For a detailed scholarly account of this interdependency, see Blair (1976). A riveting literary description is offered by Clavell’s novel Whirlwind (1986).
[28] For a typical example of such calculations, see Deeley (2013).
[29] This chart first appeared in Nitzan and Bichler (1995: 499). An earlier, non-differential precursor is given in Rowley, Bichler and Nitzan (1989: 26, Figure 8).
[30] In the late 1970s and early 1980s, and again during the 2000s, differential decumulation was sometimes followed by a string of conflicts stretching over several years. In these instances, the result was a longer time lag between the initial spell of differential decumulation and some of the subsequent conflicts.
[31] It is important to note here that the energy conflicts have led not to higher oil profits as such, but to higher differential oil profits. For example, in 1969-70, 1975, 1980-82, 1985, 1991, 2001‑02, 2006-07, 2009 and 2012, the rate of return on equity of the Petro‑Core actually fell; but in all cases the fall was either slower than that of the Fortune 500 or too small to close the positive gap between them, so despite the decline, the Petro‑Core continued to beat the average.
[32] Although there was no official conflict in 1996-97, there was plenty of violence, including an Iraqi invasion of Kurdish areas and U.S. cruise missile attacks (‘Operation Desert Strike’).
[33] For the details underlying the individual energy conflicts, as well as a broader discussion of the entire process, see Bichler and Nitzan (1996), Nitzan and Bichler (2002: Ch. 5), Bichler and Nitzan (2004) and Nitzan and Bichler (2006).
[34] Figure 5 would look virtually the same – and would lead to the exact same conclusions – if instead of the integrated oil companies we used the oil and gas sector as a whole. As noted in endnote 19, while the two groupings differ in overall size, their EPS measures are almost perfectly correlated.
[35] The notion of ‘enfoldment’ is beautifully articulated by Bohm (1980) and Bohm and Peat (2000).
[36] See Bichler, Rowley and Nitzan (1989: Section 2.3) for a prediction of the first conflict and Bichler and Nitzan (1996: Section 8) for a prediction of the second.
[37] The first version of this figure – for the United States only – appeared in Nitzan (2001: Figure 9, p. 260). Joseph Francis’ meticulous research (2013) corrected an error in our original buy-to-build data for the United States, revised and updated these data till 2012 and provided the first ever long-term estimates for the United Kingdom. For a discussion, see Bichler and Nitzan (2013). Francis’ data and computation are available here:
http://bnarchives.yorku.ca/381/03/20131000_francis_the_buy_to_build_indicator_data.xls.
[38] Contrary to conventional belief, stagflation is anything but an anomaly. In modern capitalism, it is in fact the rule rather than the exception. To see why this is so, note that capitalist societies always operate with greater or lesser slack (just think of Marx’s ‘reserve army of the unemployed’ or the monetarist/new-classical ‘natural rate of unemployment’). In other words, capitalist societies always stagnate relative to their full potential, so, technically speaking, inflation always appears in the midst of stagnation – i.e., as stagflation (Nitzan 1992: Ch. 7; Nitzan and Bichler 2009a: Ch 16).
[39] The tight correlations between the two countries are shown in Bichler and Nitzan (2013: Figures 3 and 4, p. 77).
[40] For other studies of breadth and depth, see Nitzan and Bichler (2002) on Israel, Park (2013, 2015 forthcoming) on South Korea, and Brennan (2014) on Canada.
[41] For analyses and debate, see Bichler and Nitzan (2008a, 2009), Nitzan and Bichler (2009b) and Kliman, Bichler and Nitzan (2011).
[42] For a detailed examination of these asymptotes in the United States, see Bichler and Nitzan (2012a).
[43] For the personal distribution of income and assets, see Piketty (2014); for the aggregate share of profit, see Bichler and Nitzan (2012a: Figure 11, p. 41 and Figure 13, p. 44); for the differential earnings of dominant capital, see Nitzan and Bichler (2014: Figure 14, p. 143).
[44] For more on this transition from breadth to depth, see Bichler and Nitzan (2004), Nitzan and Bichler (2006) and Bichler and Nitzan (2008b).
[45] While the correlation between inflation and the level of ‘real’ crude oil prices dropped to a negligible 0.14, the correlation between inflation and the rate of change of ‘real’ crude oil prices remains high at 0.78.
[46] Most analyses of this decline seem to replicate the explanations of the sharp price rise of the 1970s – only in reverse (see endonte 25). Some, like Daniel Yergin (2014), swear by the ‘old-fashioned forces of supply and demand’, stating that while ‘there may be surplus of geopolitical risk in the world, there is an even greater surplus of oil’. Others, such as Rafael Ramirez, Venezuela’s foreign minister and the former head of state oil company PDVSA, focus on geopolitics. The recent drops, he argues, occurred ‘not due to market fundamentals, but to price manipulation to create economic problems among major producing countries’ (Rathbone, Rodrigues, and Schipani 2014). The main culprit is Saudi Arabia. According to this view, the Saudis, possibly with a nod from the United States, have orchestrated a ‘new oil-price war’. One effect of this price war is to clip the wings of U.S. shale-oil firms whose booming production challenges the Saudis’ primacy. Naturally, this impact doesn’t make Washington happy. But according to proponents of this argument, that is a small price to pay in exchange for the havoc inflicted by lower oil prices on America’s current enemies – namely Russia, Iran and Venezuela – and for having the world economy stimulated by a lower ‘oil tax’ (Dyer and Crooks 2014; Lucas and McLannahan 2014). Astute commentators are careful to note the deflationary impact of lower oil prices, but this ‘mixed blessing’ rarely makes it to the front page.
[47] In this and the following paragraph we again use inverted commas to highlight concepts we find problematic (see endnote 2).
[48] Early neoclassicists such as Stanley Jevons and Alfred Marshall admitted quite openly that wants, desires and satisfaction cannot be observed, let alone quantified; but they insisted on using them nonetheless, lest the whole edifice of their utilitarian economics comes down crashing (Jevons 1871: 11; Marshall 1920: 78; Nitzan and Bichler 2009a: 128-130). This insistence was later formalized by Paul Samuelson’s concept of ‘revealed preferences’ (1938) – the idea that it is perfectly OK for economists to use reality to explain preferences instead of the other way around (Nitzan and Bichler 2009a: Ch. 5).
[49] A Google image search for phrases such as ‘petroleum demand’ or ‘supply of oil’ yields countless empirical charts. The series in the charts are labelled ‘demand’ and ‘supply’, but these titles are deeply misleading: their data measure not the desires of buyers and sellers as the theory mandates, but their actual consumption and production, which may have nothing to do with those desires, whatever they are.
[50] (This endnote is meant for the economically initiated.) In practice, the observed depletion/build-up of inventories consists of two components: intended and unintended. When the intended component is zero, the depletion (build-up) is entirely unintended, by definition; and it is only then that the excess consumption (production) is equal to the excess demand (supply). However, since the desires of buyers and sellers are unknown, economists have no way of knowing which part of the inventory change is intended and which is unintended. And as long as the two components remain mingled, the accuracy of this scarcity proxy is impossible to assess.
References
Anonymous. 2002. Don't Mention the O-Word -- Iraq's Oil. How Would an American Strike Affect Oil Reserves, and OPEC? The Economist, September 14, pp. 25-27.
Baines, Joseph. 2013a. Food Price Inflation as Redistribution: Towards a New Analysis of Corporate Power in the World Food System. New Political Economy: 1-34, published electronically on April 22.
Baines, Joseph. 2013b. Walmart’s Contested Expansion in the Retail Business: Differential Accumulation, Institutional Restructuring and Social Resistance. Monograph, Political Science, York University, pp. 1-33.
Baines, Joseph. 2014. The Ethanol Boom and the Restructuring of the Food Regime. Working Papers on Capital as Power (2014/03, July): 1-50.
Bichler, Shimshon, and Jonathan Nitzan. 1996. Putting the State In Its Place: US Foreign Policy and Differential Accumulation in Middle-East "Energy Conflicts". Review of International Political Economy 3 (4): 608-661.
Bichler, Shimshon, and Jonathan Nitzan. 2004. Dominant Capital and the New Wars. Journal of World-Systems Research 10 (2, August): 255-327.
Bichler, Shimshon, and Jonathan Nitzan. 2008a. Contours of Crisis: Plus ça change, plus c'est pareil? Dollars & Sense, December 29.
Bichler, Shimshon, and Jonathan Nitzan. 2008b. From Welltop to Laptop? Monograph, Jerusalem and Montreal: 1-4.
Bichler, Shimshon, and Jonathan Nitzan. 2009. Contours of Crisis II: Fiction and Reality. Dollars & Sense, April 28.
Bichler, Shimshon, and Jonathan Nitzan. 2012a. The Asymptotes of Power. Real-World Economics Review (60, June): 18-53.
Bichler, Shimshon, and Jonathan Nitzan. 2012b. Capital as Power: Toward a New Cosmology of Capitalism. Real-World Economics Review (61, September): 65-84.
Bichler, Shimshon, and Jonathan Nitzan. 2013. Francis' Buy-to-Build Estimates for Britain and the United States: A Comment. Review of Capital as Power 1 (1): 73-78.
Bichler, Shimshon, Jonathan Nitzan, and Tim Di Muzio. 2012. The 1%, Exploitation and Wealth: Tim Di Muzio interviews Shimshon Bichler and Jonathan Nitzan. Review of Capital as Power 1 (1): 1-22.
Bichler, Shimshon, Jonathan Nitzan, and Piotr Dutkiewicz. 2013. Capitalism as a Mode of Power: Piotr Dutkiewicz in Conversation with Shimshon Bichler and Jonathan Nitzan. In 22 Ideas to Fix the World: Conversations with the World's Foremost Thinkers, edited by P. Dutkiewicz and R. Sakwa. New York: New York University Press and the Social Science Research Council, pp. 326-354.
Bichler, Shimshon, Jonathan Nitzan, and Robin Rowley. 1989. The Political Economy of Armaments. Working Paper 7/89, Department of Economics, McGill University, Montreal, pp. 1-34.
Bichler, Shimshon, Robin Rowley, and Jonathan Nitzan. 1989. The Armadollar-Petrodollar Coalition: Demise or New Order? Working Paper 11/89, Department of Economics, McGill University, Montreal, pp. 1-63.
Blair, John M. 1976. The Control of Oil. New York: Vintage Books.
Blinder, Alan S. 1979. Economic Policy and the Great Stagflation. New York: Academic Press.
Blinder, Alan. S., and Jeremy B. Rudd. 2008. The Supply-Shock Explanation of the Great Stagflation Revisited. December. NBER Working Paper Series (14563): 1-80.
Bohm, David. 1980. Wholeness and the Implicate Order. London: Routledge & Kegan Paul Ltd.
Brennan, Jordan. 2012a. The Power Underpinnings, and Some Distributional Consequences, of Trade and Investment Liberalisation in Canada. New Political Economy (iFirst): 1-33.
Brennan, Jordan. 2012b. A Shrinking Universe: How Concentrated Corporate Power is Shaping Income Inequality in Canada, Canadian Centre for Policy Alternatives, Ottawa, November, pp. 1-49.
Clavell, James. 1986. Whirlwind. 1st ed. New York: W. Morrow.
Deeley, Robert. 2013. Commodity Prices & Political Risk. Commodities Now, December.
Francis, Joseph. 2013. The Buy-to-Build Indicator: New Estimates for Britain and the United States. Review of Capital as Power 1 (1): 63-72.
Gagnon, Marc Andre. 2009. The Nature of Capital in the Knowledge-Based Economy: The Case of the Global Pharmaceutical Industry. Unpublished PhD dissertation, Department of Political Science, York University.
Hager, Sandy Brian. 2012. Investment Bank Power and Neoliberal Regulation: From the Volcker Shock to the Volcker Rule. In Neoliberalism in Crisis, edited by H. Overbeek and B. van Apeldoorn. Basingstoke, UK: Palgrave Macmillan, pp. 68-92.
Hager, Sandy Brian. 2013a. Public Debt, Ownership and Power: The Political Economy of Distribution and Redistribution. Unpublished PhD Dissertation, Department of Political Science, York University.
Hager, Sandy Brian. 2013b. What Happened to the Bondholding Class? Public Debt, Power and the Top One Per Cent. New Political Economy: 1-28, published electronically on April 16.
Hoyos, Carla. 2006. OPEC Set to Defend $60 Global Minimum. Financial Times, October 20, pp. 1.
Hubbert, Marion King. 1956. Nuclear Energy and the Fossil Fuels. Paper presented before the Spring Meeting of the Southern District, Division of Production, American Petroleum Institute, Plozo Hotel, Son Antonio, Texas, March 7-9.
Jevons, Stanley W. 1871. [1970]. The Theory of Political Economy. Edited with an introduction by R. D. Collison Black. Harmondsworth, Middlesex, England: Penguin Books Ltd.
Klare, Michael. 2005. The Failed Mission To Capture Iraqi Oil. Information Clearing House, September 22.
Kliman, Andrew, Shimshon Bichler, and Jonathan Nitzan. 2011. Systemic Crisis, Systemic Fear: An Exchange. Special Issue on 'Crisis'. Journal of Critical Globalization Studies (4, April): 61-118.
Marshall, Alfred. 1920. Principles of Economics. An Introductory Volume. 8th ed. London: Macmillan.
McMahon, James. 2013. The Rise of a Confident Hollywood: Risk and the Capitalization of Cinema. Review of Capital as Power 1 (1): 23-40.
Nitzan, Jonathan. 1992. Inflation as Restructuring. A Theoretical and Empirical Account of the U.S. Experience. Unpublished PhD Dissertation, Department of Economics, McGill University, Montreal.
Nitzan, Jonathan. 2001. Regimes of Differential Accumulation: Mergers, Stagflation and the Logic of Globalization. Review of International Political Economy 8 (2): 226-274.
Nitzan, Jonathan, and Shimshon Bichler. 1995. Bringing Capital Accumulation Back In: The Weapondollar-Petrodollar Coalition -- Military Contractors, Oil Companies and Middle-East "Energy Conflicts". Review of International Political Economy 2 (3): 446-515.
Nitzan, Jonathan, and Shimshon Bichler. 2000. Inflation and Accumulation: The Case of Israel. Science & Society 64 (3): 274-309.
Nitzan, Jonathan, and Shimshon Bichler. 2002. The Global Political Economy of Israel. London: Pluto Press.
Nitzan, Jonathan, and Shimshon Bichler. 2003. It's All About Oil. News From Within XIX (1, January): 8-11.
Nitzan, Jonathan, and Shimshon Bichler. 2006. New Imperialism or New Capitalism? Review XXIX (1, April): 1-86.
Nitzan, Jonathan, and Shimshon Bichler. 2007. War Profits, Peace Dividends. Hebrew. 2nd Expanded and Revised ed. Haifa: Pardes.
Nitzan, Jonathan, and Shimshon Bichler. 2009a. Capital as Power. A Study of Order and Creorder. RIPE Series in Global Political Economy. New York and London: Routledge.
Nitzan, Jonathan, and Shimshon Bichler. 2009b. Contours of Crisis III: Systemic Fear and Forward-Looking Finance. Dollars & Sense, June 12.
Nitzan, Jonathan, and Shimshon Bichler. 2014. Can Capitalists Afford Recovery? Three Views on Economic Policy in Times of Crisis. Review of Capital as Power 1 (1): 110-155.
Nitzan, Jonathan, Robin Rowley, and Shimshon Bichler. 1989. Changing Fortunes: Armaments and the U.S. Economy. Working Paper 8/89, Department of Economics, McGill University, Montreal, pp. 1-27.
Park, Hyeng-Joon. 2013. Dominant Capital and the Transformation of Korean Capitalism: From Cold War to Globalization. Unpublished PhD Dissertation, Department of Political Science, York University, Toronto.
Park, Hyeng-Joon. 2015 forthcoming. Korea’s Post-1997 Restructuring: An Analysis of Capital as Power. Review of Radical Political Economics: 1-44.
Rowley, Robin, Shimshon Bichler, and Jonathan Nitzan. 1989. The Armadollar-Petrodollar Coalition and the Middle East. Working Paper 10/89, Department of Economics, McGill University, Montreal, pp. 1-54.
Samuelson, Paul A. 1938. A Note on the Pure Theory of Consumer's Behaviour. Economica 5 (17, February): 61-71.
Veblen, Thorstein. 1904. [1975]. The Theory of Business Enterprise. Clifton, New Jersey: Augustus M. Kelley, Reprints of Economics Classics.