Working Papers on Capital as Power, No. 2016/07, November 2016
A CasP Model of the Stock Market
Shimshon Bichler and Jonathan Nitzan [1]
Jerusalem and Montreal, November 2016
bnarchives.net / Creative Commons
![]()
Abstract
Most explanations of stock market booms and busts are based on contrasting the underlying ‘fundamental’ logic of the economy with the exogenous, non-economic factors that presumably distort it. Our paper offers a radically different model, examining the stock market not from the mechanical viewpoint of a distorted economy, but from the dialectical perspective of capitalized power. The model demonstrates that (1) the valuation of equities represents capitalized power; (2) capitalized power is dialectically intertwined with systemic fear; and (3) systemic fear and capitalized power are mediated through strategic sabotage. This triangular model, we posit, can offer a basis for examining the asymptotes, or limits, of capitalized power and the ways in which these asymptotes relate to the historical and ongoing transformation of the capitalist mode of power.
1. Introduction
The purpose of this paper is to outline a capital-as-power, or CasP, model of the stock market. There are two reasons why such a model is needed: first, the stock market has become the main compass of the capitalist mode of power; and, second, so far, we have not developed a CasP theory to describe it. [2]
Surprising as it may sound, all long-term modeling of the stock market derives from a single meta-dogma that we have previously dubbed the ‘mismatch thesis’ (Bichler and Nitzan 2009, 2015a). The basic premise of this dogma is the general bifurcation between economics and politics (a shorthand for all non-economic realms of society) and the further division, within economics, between the so-called ‘real’ and ‘nominal’ spheres. Finance in this dogma is a symbolic nominal mirror that reflects the underlying real economy, but that reflection – and this is the key point here – is imperfect. Financial magnitudes tend to mismatch reality, and the purpose of the model is to explain this mismatch and predict its consequences. [3]
Our CasP model begins not by negating these conventional findings and predictions, but by giving them a totally different interpretation. The model suggests that underneath the economic veneer of the mismatch thesis lies a power process, and that it is this power process – and not economic productivity and utility – that drives the stock market. This alternative interpretation is important for three reasons: first, it gives rise to questions that conventional theories are unable to ask; second, it leads to findings that contradict the underlying assumptions of both mainstream and heterodox political economy; and, third, it might open the door for a better understanding of the capitalist mode of power and how it might be resisted and transformed.
The paper consists of eight sections. The substantive discussion begins in Section 2 with a bird’s eye view of stock-market booms and busts over the past two centuries. This section identifies some of the market’s quantitative patterns along with the qualitative power transformations that underlie them. Section 3 explains the mainstream mismatch thesis, while Section 4 describes the valuation model of John Hussman, President of the Hussman Investment Trust, which, as far as we know, offers the best consistent predictions of long-term stock market returns. The remainder of the paper outlines our own model, illustrated by the enclosed Penrose triangle. Section 5 shows that one can reproduce Hussman’s results by looking not at the utilitarian economics of production and consumption, but directly at capitalized power. Section 6 explores how capitalized power is dialectically intertwined with what we call systemic fear. Section 7 suggests that the driving force behind both capitalized power and systemic fear is what Thorstein Veblen called strategic sabotage and speculates on how economic policy has been integrated into the CasP-driven stock market. Section 8 concludes with a brief summary and some thoughts about the future.

Before turning to our argument, we should note that, although the principles we deal with here are general, our empirical analysis is restricted to the United States. Given this limitation, our article should be taken as explorative and tentative rather than exhaustive and definitive.
2. Major Bear Markets
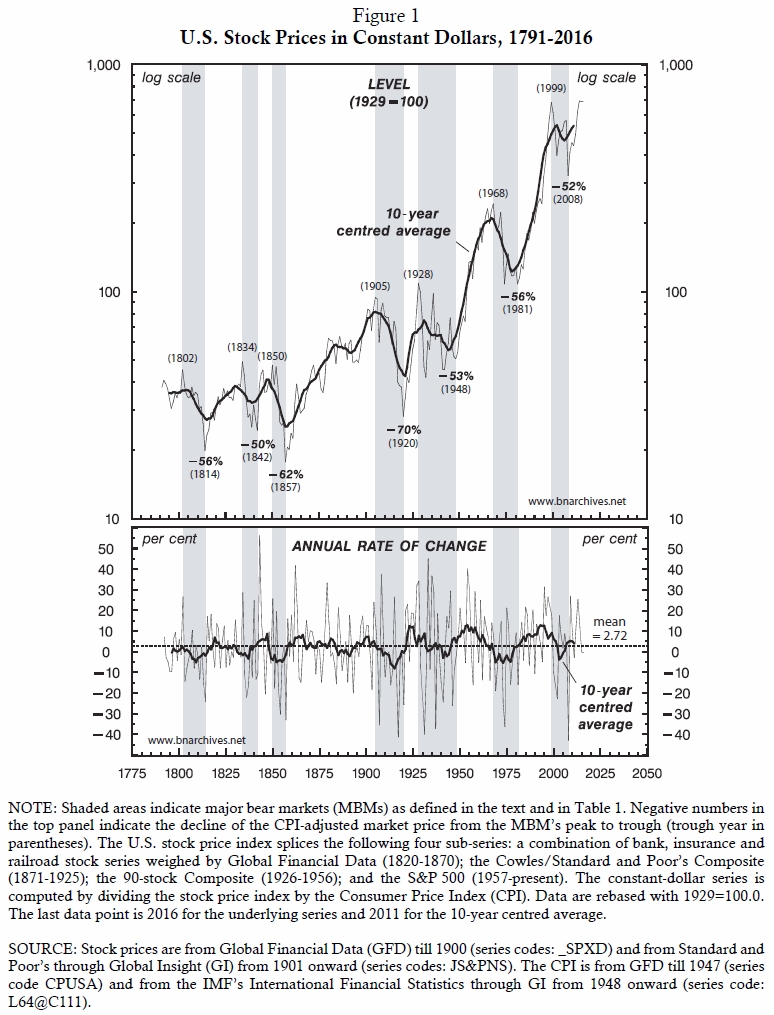
Begin with Figure 1, which shows annual U.S. stock prices since the late eighteenth century. The top panel displays levels, while the bottom panel shows rates of change. Prices are expressed in ‘constant dollars’, which means that, for every year, the nominal stock price index is divided by the CPI (Consumer Price Index).
Purchasing Power or Differential Power?
Economists go through this transformation in order to display stock prices in so-called ‘real terms’. And what they mean by ‘real terms’ here is purchasing power. [4] According to this view, each reading on the thin line in the top panel of the chart shows the purchasing power, denominated in universal ‘utils’, of the owners of the largest U.S.-listed firms. [5] For example, if the thin line rises by 10 per cent, that means that stock owners like Buffett and Soros can buy 10 per cent more groceries (measured in utils), or purchase 10 per cent more fuel for their vehicles (again, weighted in utils). Conversely, if this line drops by 30 per cent the implication is that the Buffetts and Soroses of the world can afford 30 per cent less clothing or can spend only 30 per cent less on childcare (both counted in utils).
Surprising as it may seem, this is the dominant view. In a hyper-liberal universe, goes the argument, every individual, whether a billionaire owner or a propertyless beggar – and by extension, every association of individuals, be it a corporation, a government, or an NGO – is ultimately driven by an innate desire to maximize hedonic pleasure, and the compulsive conversion of all nominal measures into ‘real terms’ is a way of guiding and gauging this utilitarian obsession.
But there is another, perhaps more meaningful way to think about this computation. When we divide stock prices by the CPI, we are computing a ratio between the prices of two baskets: a basket of listed corporate stocks and a basket of consumer goods and services. And if we think of relative commodity prices as reflecting the relative power of their owners, then what we measure here is not only purchasing power, but also differential power: the power of those who own stocks relative to the power of those who own consumer goods and services. So we have two measures in one: purchasing power and differential power, and in what follows we focus solely on the latter.
The Stylized Facts
So what does Figure 1 show us? First, it shows that, since the late eighteenth century, the differential power of stock owners relative to owners of consumer goods and services has risen exponentially (notice that the top panel uses a log scale, so equal vertical distances represent multiples of 10). The mean geometric growth rate for the entire period is 1.28 per cent. [6] If this number seems small, note that over the past 215 years it has compounded to a nearly 18-fold rise in the relative power of stock owners. The bottom panel of the chart shows the annual rate of change. The thin series in this panel displays, for each year, the growth of U.S. stock prices in constant dollars relative to the previous year (with the mean arithmetic growth rate of 2.72 per cent indicated by the horizontal dashed line).
Each panel also show a thick series. In each case, the series displays the 10-year centred average of the respective thin series. Every observation in the thick series is the mean value of the respective thin series (level or rate of change) computed over a 10-year window. Since the moving average is centred, the window consists of the five years preceding the observation and the five years following it. For example, the 10-year centred average for 1990 is the mean value over the 1986-1995 period.
The thick series in the top panel is useful in describing what we call ‘major bear markets’, or MBMs. [7] In a market whose price trends upwards exponentially, the most dramatic event is a protracted crash, or MBM. We define an MBM as a period during which the following two conditions apply: (1) the 10-year centred average of the market price, expressed in constant dollars, is declining; and (2) every peak of the annual series is followed by a lower peak. Based on this dual definition, we can count seven MBMs (shaded in grey): three in the early half of the nineteenth century, three in the twentieth and one in the twenty-first. The top panel of Figure 1 marks the peak and trough years of every MBM, along with the total stock price drop in CPI-adjusted terms. This information is summarized in Table 1.
The Quantities and Qualities of Power
Now, when the market is booming, the popular media loves to insist that ‘this time is different’. The talking heads claim that something fundamental has changed, and that the good times can roll on forever. This point was infamously made in October 1929 by Irving Fisher, just before he lost his huge fortune, equivalent to $100 million in today’s prices, to the Great Crash (Anonymous 1929), and then again in 1999 by a couple of far-sighted analysts, who predicted that the stock market would triple in five years, only to see it halved (Glassman and Hassett 1999).
The pundits like to ridicule these ‘new-order’ forecasts with counter-titles such as Irrational Exuberance (Shiller 2000) and tongue-in-cheek phrases like This Time is Different (Reinhart and Rogoff 2009). The market, they say, has its own natural, mean-reverting pattern, and there is nothing anyone can do to change it. And on the face of it, they seem to have a point.
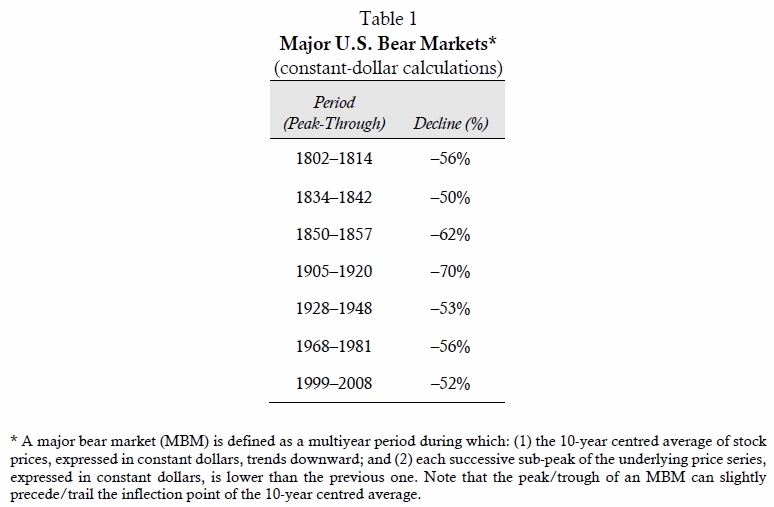
Figure 2 magnifies the lower panel of Figure 1, ignoring the year-on-year variations and showing only the 10‑year centred average. This larger and cleaner exposition helps us discern three general patterns: (1) the growth rate of stock prices is not even, but mean-reverting; (2) it is not random, but cyclical; and (3) its cycle is not haphazard, but instead displays a fairly stable duration (though its amplitude in the twentieth century is twice that of the nineteenth’s). On the whole, then, the process certainly resembles a naturally reoccurring phenomenon.
But is it? Notice that, during the past century or so, every MBM was followed by a major creordering of capitalized power and a significant rewriting of the capitalist nomos. [8] Thus, the MBM of 1905-1920 was followed by the rise of corporate capitalism; the MBM of 1928-1948 was followed by the rise of the Keynesian welfare-warfare state; and the MBM of 1968-1981 was followed by the rise of global neoliberalism. In this regard, the first MBM of the twenty-first century, from 1999 to 2008, seems incomplete: although the capitalist system is already rattling, it might take another MBM to bring about a significant creordering similar to the previous three.
Now the key thing about these creorderings is that they are qualitatively different from each other. So in the end, we can say that ‘this time – like every other time – is both similar and different’: the similar quantities of power are driven by different qualities of power.
3. The Mismatch Thesis
How should we make sense of these long-term patterns? As noted, the common and perhaps only theory on offer is the mismatch thesis. According to this thesis, capitalism – like any other economic system – is a mode of production and consumption that can be described and analysed in ‘real terms’ (i.e. in utils). When economists say that the economy grew by 5 per cent, what they mean – whether they are aware of it or not – is that there were 5 per cent more utils produced this year than last. This is the so-called real sphere of the economy.
But the capitalist economy has another, financial sphere, and that sphere is denominated not in real utils, but in nominal dollars and cents. The stock market is part of this financial sphere, and it plays a crucial role: it acts as a giant mirror that reflects what happens – or, to be more precise, what will happen – in the real sphere.
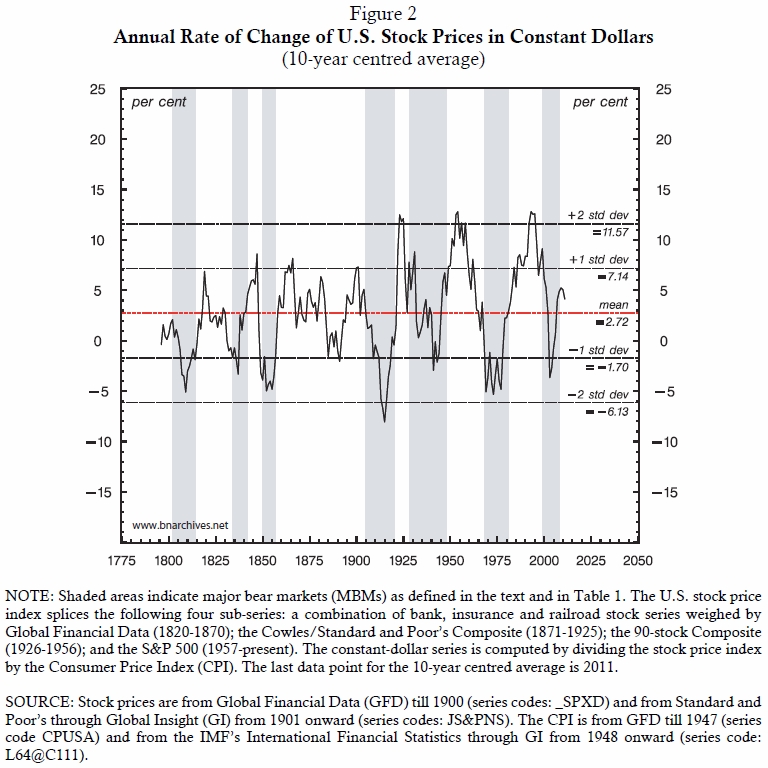
House of Mirrors
Picture 1 illustrates how this mirror operates. According to the mismatch thesis, which can be traced back to Irving Fisher (1896, 1907), capitalists own machines, raw materials and knowledge that together make up the ‘real capital stock’ (top left quadrant). This real capital stock will produce, in the future, real income services (top right) that the capitalists will in turn sell for nominal future profit (bottom right). And the expectations of this future profit are capitalized by their owners, here and now, into present nominal market value (bottom left). [9] Now if these transmutations are accurate, we have a match; if they are inaccurate, we have a mismatch. [10]
Capitalization, Fundamentals and Mean Reversion
Let us now narrow our focus and examine the final stage of this process, using the following notions in conjunction with Equations 1-3:
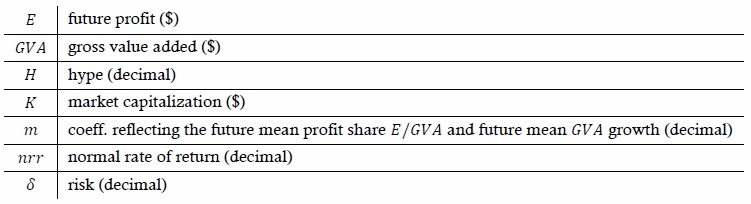
Equation 1 conceptualizes the way in which investors capitalize future profit:
In this equation the numerator
represents expected future profit, while the denominator is the discount rate.
The ![]() in the numerator is the actual
future profit that will be earned. Since this future profit cannot be
known here and now, capitalists have to guestimate it; and, usually, their
projections are either too optimistic or too pessimistic. This
optimism/pessimism is captured by the hype coefficient
in the numerator is the actual
future profit that will be earned. Since this future profit cannot be
known here and now, capitalists have to guestimate it; and, usually, their
projections are either too optimistic or too pessimistic. This
optimism/pessimism is captured by the hype coefficient ![]() . When capitalists happen to be right on target,
. When capitalists happen to be right on target, ![]() . This situation, though, is
exceptional. Normally, capitalists are either overhyped, so
. This situation, though, is
exceptional. Normally, capitalists are either overhyped, so ![]() , or underhyped, so
, or underhyped, so ![]() . The net effect of hype is to
increase or decrease the profit that owners discount here and now relative
to the profit they (or subsequent owners) will actually earn in the future.
. The net effect of hype is to
increase or decrease the profit that owners discount here and now relative
to the profit they (or subsequent owners) will actually earn in the future.
The denominator, which
represents the discount rate, is also made up of two components. The first
component is the normal rate of return ![]() , which capitalists believe they are entitled to
when investing in so-called riskless assets (such as U.S. government bonds held
to maturity). The second component – the scaling factor
, which capitalists believe they are entitled to
when investing in so-called riskless assets (such as U.S. government bonds held
to maturity). The second component – the scaling factor ![]() – accounts for the additional
return that capitalists demand in order to compensate for the relative
riskiness of the particular asset in question (in this case, the risk of
equities relative to U.S. government bonds). For example, if the normal rate of
return
– accounts for the additional
return that capitalists demand in order to compensate for the relative
riskiness of the particular asset in question (in this case, the risk of
equities relative to U.S. government bonds). For example, if the normal rate of
return ![]() is 0.05, or 5 per cent, and
stocks are deemed twice as risky as government bonds,
is 0.05, or 5 per cent, and
stocks are deemed twice as risky as government bonds, ![]() will be 2 and the discount rate
will be 0.1, or 10 per cent.
will be 2 and the discount rate
will be 0.1, or 10 per cent.
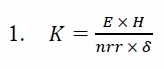
The problem with
Equation 1 is that profits oscillate violently, so, for the purpose of
prediction, it is convenient to take a simplifying shortcut. Instead of estimating
future profit directly, capitalists and analysts often start with the overall
dollar value of production, or gross value added ![]() , and then introduce two
guestimates. Looking all the way into the deep future, they project that (1)
, and then introduce two
guestimates. Looking all the way into the deep future, they project that (1) ![]() will grow at a certain average
rate, say 5 per cent; and (2) that the share of profit in
will grow at a certain average
rate, say 5 per cent; and (2) that the share of profit in ![]() will oscillate around a
certain average, say 6 per cent. Packing these two guestimates into a
coefficient
will oscillate around a
certain average, say 6 per cent. Packing these two guestimates into a
coefficient ![]() , they can then derive market
capitalization by looking at
, they can then derive market
capitalization by looking at ![]() and
and ![]() instead of
instead of ![]() , with the hype coefficient
, with the hype coefficient ![]() denoting their excessive
optimism/pessimism regarding the magnitude of
denoting their excessive
optimism/pessimism regarding the magnitude of![]() . This new computation is shown
in Equation 2:
. This new computation is shown
in Equation 2:
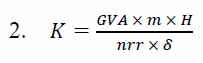
Equation 3 rearranges the
terms of Equation 2. It shows that market capitalization is the product of two
components: (1) ![]() , which is relatively
unambiguous, regularly measured and broadly agreed upon; and (2) the
product/ratio of the remaining four components, which comprises a hodgepodge of
guesses, hard-to-pin-down conventions and shifting beliefs.
, which is relatively
unambiguous, regularly measured and broadly agreed upon; and (2) the
product/ratio of the remaining four components, which comprises a hodgepodge of
guesses, hard-to-pin-down conventions and shifting beliefs.
This decomposition leads us to
the gist of the mismatch thesis. If the future were known, the four-element
product/ratio on the right-hand side of Equation 3 would probably sum up
to a constant: ![]() is pretty much a fixed number
(by definition),
is pretty much a fixed number
(by definition), ![]() would be a fixed number equal
to the trend growth of
would be a fixed number equal
to the trend growth of ![]() and, since there is no
uncertainty, both hype
and, since there is no
uncertainty, both hype ![]() and the risk coefficient
and the risk coefficient ![]() would be 1.
would be 1.
As we noted, though, the future is not only unknown, but unknowable; and when capitalists and analysts deal with the unknowable, the regrettable result, or so we are told, is uncertainty, irrationality and distortions. All in all, then, the second component on the right-hand side of Equation 3 is sure to oscillate. But this oscillation, the theory’s advocates assure us, is part and parcel of the mismatch thesis: while uncertainty, irrationality and distortions abound, they are not unbounded. Although the movement of the second element on the right-hand side of Equation 3 may have a large amplitude and a long duration, it is ultimately self-correcting – or, in the more formal language of statistics, mean-reverting – and this mean-reversion is the theoretical basis of all long-term valuation models.
4. Hussman’s Mismatch Model
So let us now see how these principles pan out in practice. Our focus in this section is on the model of fund manager John Hussman, which, as far as we know, offers the best prediction of long-term future returns. [11]
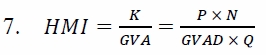
Hussman’s Mismatch Indicator (HMI)
The model is based on Hussman’s mismatch index ![]() (our
notation), given
by Equation 4:
(our
notation), given
by Equation 4:
The two components of ![]() are plotted in Figure 3.
The solid thick series is market capitalization (the numerator of
Equation 4), while the dashed series is gross value added (the
denominator). Both series pertain to U.S.-based nonfinancial corporations, both
are denominated in dollars, and each is plotted against a log scale. [12]
are plotted in Figure 3.
The solid thick series is market capitalization (the numerator of
Equation 4), while the dashed series is gross value added (the
denominator). Both series pertain to U.S.-based nonfinancial corporations, both
are denominated in dollars, and each is plotted against a log scale. [12]
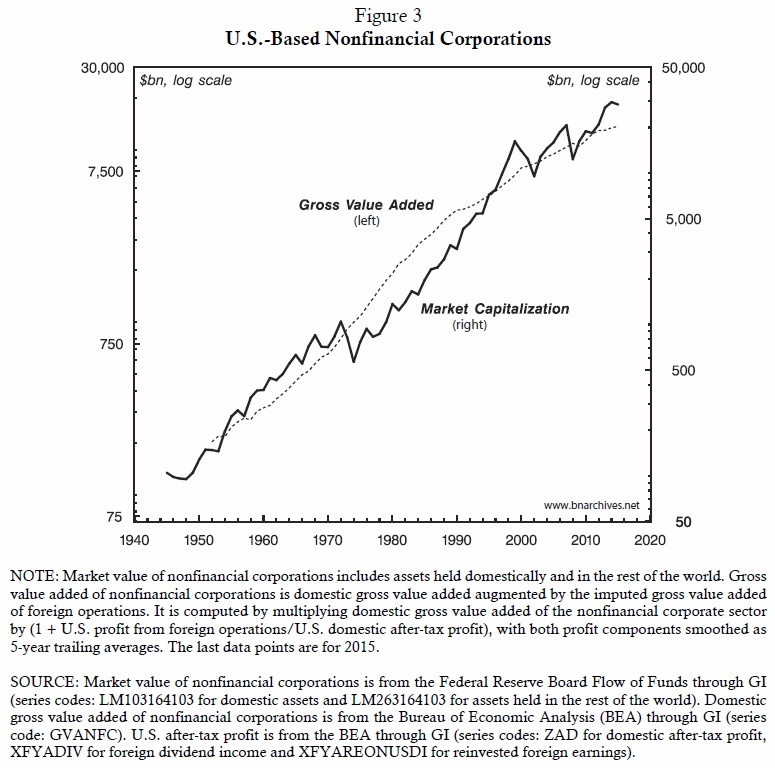
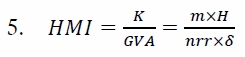
Figure 4 shows Hussman’s
mismatch index ![]() against the left log scale.
Equation 5 shows that this indicator is equal to the four-element component
from the right-hand side of Equation 3. And as the chart suggests, the
index is indeed mean-reverting: it fluctuates roughly between a low of 0.6 and
a high of 2.3.
against the left log scale.
Equation 5 shows that this indicator is equal to the four-element component
from the right-hand side of Equation 3. And as the chart suggests, the
index is indeed mean-reverting: it fluctuates roughly between a low of 0.6 and
a high of 2.3.
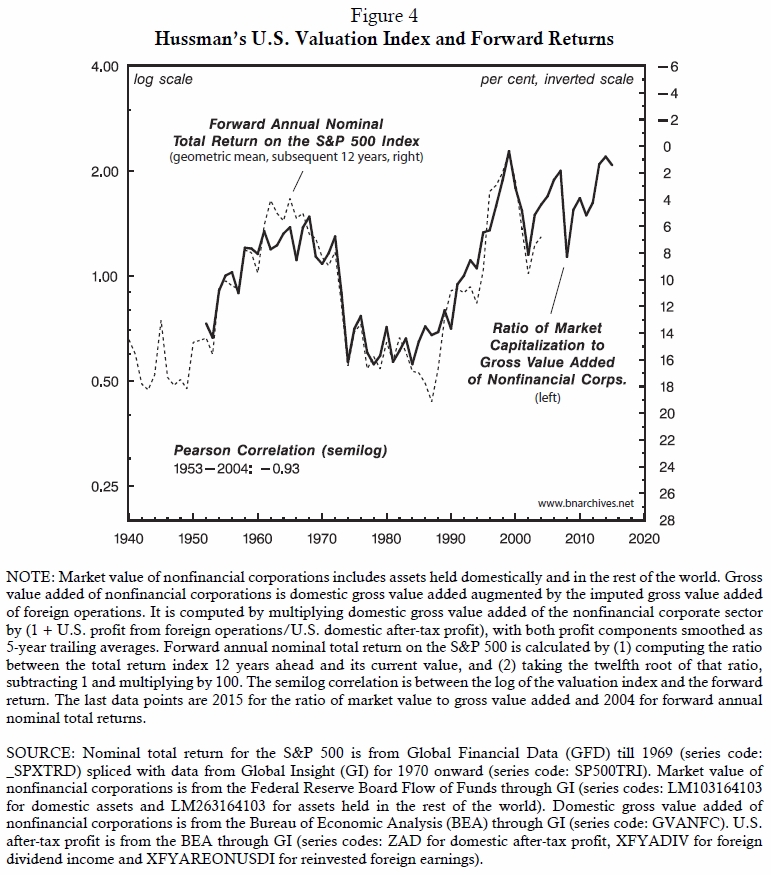
Predicting Forward Returns
Now, why should this mismatch ratio be of any interest to investors? The reason is given by the dashed series, plotted against the inverted right scale. This series measures the forward annual nominal total rate of return on equities twelve years into the future. In other words, every observation in the series tells us what investors who had bought the S&P 500 index in that particular year ended up earning in capital gains and dividends, on average, over the next twelve years.
For example, an investor who
bought the S&P 500 index in 1984, when ![]() was less than 0.6, ended up
earning an annual average of 16 per cent over the next twelve years. And how do
we know? We simply project the observation horizontally to the inverted
right-hand scale and read the result. Or take an investor who bought the market
at its 1999 peak, when
was less than 0.6, ended up
earning an annual average of 16 per cent over the next twelve years. And how do
we know? We simply project the observation horizontally to the inverted
right-hand scale and read the result. Or take an investor who bought the market
at its 1999 peak, when ![]() was nearly 2.3. Projecting the
dashed series onto the right-hand scale shows that this investor ended up
making an average nominal total return of less than 1 per cent over the next
twelve years.
was nearly 2.3. Projecting the
dashed series onto the right-hand scale shows that this investor ended up
making an average nominal total return of less than 1 per cent over the next
twelve years.
The key thing to note here is that forward total returns and the Hussman mismatch index are nearly perfectly inversely correlated: their Pearson correlation coefficient is –0.93 out of a maximum of –1. On the face of it, this result is nothing short of remarkable: while equity owners might find it difficult to predict what will happen to their investments in the next few months or the next couple of years, according to Hussman’s mismatch model in Figure 4 they can know pretty well what they will earn over the next twelve years. (At a risk of putting the cart before the horse, note that the current reading of Hussman’s mismatch index is more or less the same as it was in 1999, just before the onset of the latest MBM. What this reading implies can be summarized in three ominous words: ‘Winter in Coming’.)
Irrationality, Risk and Return
But the model’s nearly perfect predictive record is somewhat spoiled by two troubling observations. The first observation concerns ‘economic rationality’. Mainstream economists insists that accumulation thrives on and fosters rationality (by which they mean that money prices reflect utility, and that this reflection implies Pareto-optimal-resource-allocation-read-utility-maximization). But Figure 4 seems to suggest the exact opposite: the more irrational the investors, the greater the apparent mismatch between nominal market capitalization and the real fundamentals; and the larger the mismatch, the greater the scope for accumulation – either by buying the market long when it is ‘oversold’, or shorting it when it is ‘overbought’ (relative to the fundamentals). In other words, utility-maximizing investors have an interest in – and therefore an incentive to foster – ‘economic irrationality’.
The second observation has to do with risk and return. Finance textbooks reiterate the Austrian economic mantra that the two go hand in hand: since there can be no gain without pain, or so they say, those who wish to earn more must be willing to take on a greater risk. But here too Figure 4 seems to imply otherwise: according to the historical data, the greatest future returns are available when risk is lowest (such as in the early 1980s), whereas when risk is very high (for instance, during the late 1990s), eventual returns are dismal. In other words, investors are either free riders who get something for nothing, or suckers who pay something for nothing. . . . [13]
5. The Power Model
Having outlined the conventional cosmology of finance, let us now turn it upside down by sketching our own, triangular CasP model of the stock market. We do so in three steps: in this section we examine the stock market from the viewpoint of capitalized power; in the next section we relate this capitalized power to systemic risk; and in the subsequent section we tie both capitalized power and systemic risk with strategic sabotage.
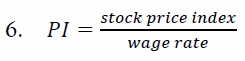
The Power Index (PI)
Figure 5 introduces our power
index and contrasts it with Hussman’s. The dashed series is Hussman’s mismatch
index ![]() plotted against the right log
scale. The solid series, plotted against the left log scale, is our own power
index
plotted against the right log
scale. The solid series, plotted against the left log scale, is our own power
index ![]() , defined as the ratio between
the S&P 500 price index and the average wage rate, normalized with its
historical mean=100:
, defined as the ratio between
the S&P 500 price index and the average wage rate, normalized with its
historical mean=100:
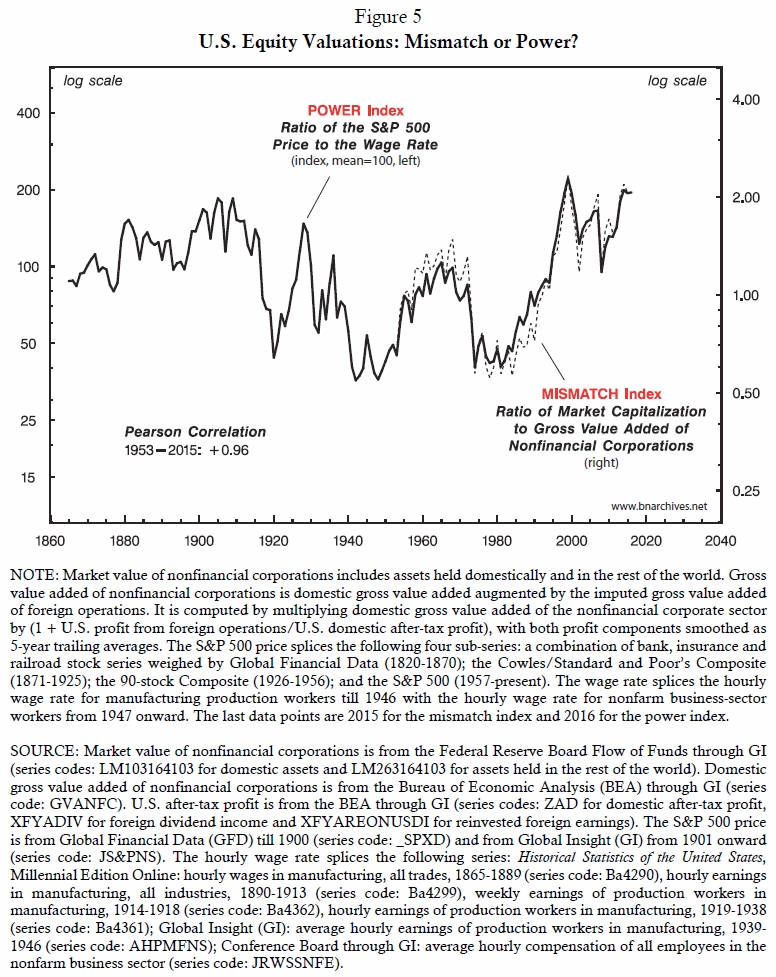
Why is the ratio of the S&P
500 price index to the wage rate a ‘power index’? To answer this question,
recall that Hussman’s mismatch index ![]() tries to match market
capitalization (which represents the aggregate purchasing power of equity holders)
with the underlying fundamentals of this capitalization (a proxy for the
aggregate income services to be produced by the corresponding real capital
stock).
tries to match market
capitalization (which represents the aggregate purchasing power of equity holders)
with the underlying fundamentals of this capitalization (a proxy for the
aggregate income services to be produced by the corresponding real capital
stock).
Our own power index ![]() is very different. First, it shifts the
discussion from ontological to operational symbolism. [14] Note that, unlike Hussman, we compare not overall
purchasing power and income services, but merely prices. For
Hussman, nominal market capitalization is an ontological symbol: it represents,
accurately or inaccurately, an external entity out there – in this case, the
‘real’ utils to be generated by the ‘real’ capital stock. In contrast, we see
stock prices and the wage rate as generative, or operational symbols. Their
ratio does not represent an outside reality, it constitutes that
reality – in this case, the capitalized power of owners imposed on the
underlying population.
is very different. First, it shifts the
discussion from ontological to operational symbolism. [14] Note that, unlike Hussman, we compare not overall
purchasing power and income services, but merely prices. For
Hussman, nominal market capitalization is an ontological symbol: it represents,
accurately or inaccurately, an external entity out there – in this case, the
‘real’ utils to be generated by the ‘real’ capital stock. In contrast, we see
stock prices and the wage rate as generative, or operational symbols. Their
ratio does not represent an outside reality, it constitutes that
reality – in this case, the capitalized power of owners imposed on the
underlying population.
The second difference is that the
constituents of the power index ![]() – stock prices and the wage rate – are
totally different creatures. Unlike the numerator and denominator of Hussman’s
mismatch model, they have no reason to match and therefore no reason to
mismatch.
– stock prices and the wage rate – are
totally different creatures. Unlike the numerator and denominator of Hussman’s
mismatch model, they have no reason to match and therefore no reason to
mismatch.
This is no coincidence. Whereas the liberal
universe tries to harmonize its categories, the CasP cosmos pits them against
each other. And indeed, instead of mirroring one another, the numerator and
denominator of ![]() represent a conflict: the clash
between those who own the capitalized means of power and those who are
controlled by them. Note that we use the average wage rate here not as a
measure of productivity or wellbeing, but as a benchmark against which to gauge
the differential power of owners. Furthermore, although strictly speaking the
wage rate pertains only to employed workers, its temporal movement approximates,
however crudely, the changing conditions of the underlying population at large.
Thus, when our power index
represent a conflict: the clash
between those who own the capitalized means of power and those who are
controlled by them. Note that we use the average wage rate here not as a
measure of productivity or wellbeing, but as a benchmark against which to gauge
the differential power of owners. Furthermore, although strictly speaking the
wage rate pertains only to employed workers, its temporal movement approximates,
however crudely, the changing conditions of the underlying population at large.
Thus, when our power index ![]() rises, this means not that the market is
distorted or that investors are economically irrational, but that the power of
equity owners relative to the underlying population increases – and vice versa
when the index falls. Moreover, and importantly, this relative power is forward
looking: it denotes not only the rulers’ relative position here and now,
but also how they expect this relative position to change in the future.
rises, this means not that the market is
distorted or that investors are economically irrational, but that the power of
equity owners relative to the underlying population increases – and vice versa
when the index falls. Moreover, and importantly, this relative power is forward
looking: it denotes not only the rulers’ relative position here and now,
but also how they expect this relative position to change in the future.
All in all, then, the mismatch and power indices are conceptually distinct and theoretically unrelated. And yet – and here we come to the important bit – despite these fundamental differences they correlate almost perfectly: according to Figure 5, their Pearson coefficient, extended over more than half a century, is +0.96 out of a maximum of +1.
Mismatch or Power?
What explains this remarkably
tight correlation? Is this a miraculous statistical fluke, or is there a hidden
connection between these seemingly different indicators? The answer emerges
from Equations 7‑11, which relate Hussman’s mismatch index ![]() to our own power index
to our own power index ![]() .
.
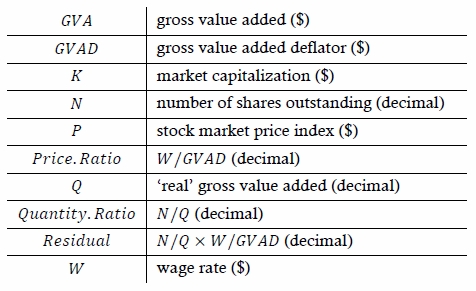
Equation 7 decomposes both market
capitalization ![]() and gross value added
and gross value added ![]() to their respective price and
quantity components (the average price of stocks
to their respective price and
quantity components (the average price of stocks ![]() and the number of outstanding
stocks
and the number of outstanding
stocks ![]() for the former, the gross value
added deflator
for the former, the gross value
added deflator ![]() and real gross value added
and real gross value added ![]() for the latter).
for the latter).
Equation 8 divides and multiplies the
denominator of Hussman’s mismatch index by the wage rate ![]() and rearranges the terms:
and rearranges the terms:
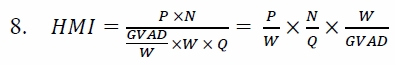
Equations 9-11 show further rearrangements, to accentuate the connection between the mismatch and power indices:
Equation 11 shows that the power index ![]() – i.e. the capitalized conflict between
equity owners and the underlying population – is in fact part and parcel of
Hussman’s mismatch index
– i.e. the capitalized conflict between
equity owners and the underlying population – is in fact part and parcel of
Hussman’s mismatch index ![]() , while the nearly perfect correlation in
Figure 5 suggests the former index is the main driver of the latter. The
combined impact on
, while the nearly perfect correlation in
Figure 5 suggests the former index is the main driver of the latter. The
combined impact on ![]() of the quantity and price ratios is a negligible
residual. [15]
of the quantity and price ratios is a negligible
residual. [15]
In this sense, the mismatch theory reminds us of the Ptolemaic geocentric view. The idea that the sun epicycles around the earth yielded fairly accurate predictions, but it was nonetheless wrong. [16] And perhaps the same might be said about the notion that capitalists and analysts price the stock market to match the so-called real fundamentals of utility and productivity: just like the geocentric view, this notion yields very tight predictions, and just like the geocentric view, it seems completely misplaced. The real driving force here is not the mismatching of future utility, but changes in organized power.
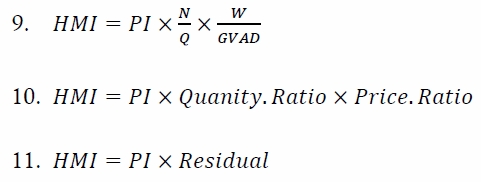
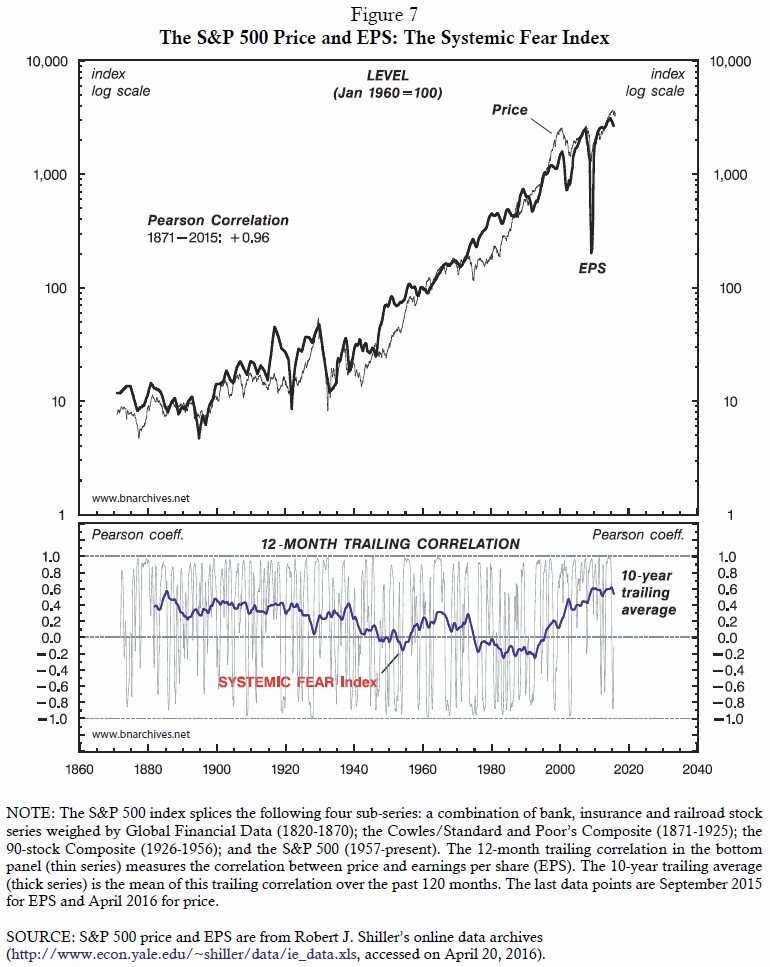
Capitalized Power and Forward Returns
Moreover, according to Figure 6, it appears that it is this actual reality of capitalized power – and not the mismatched reality of utility and productivity – that drives future returns. The chart displays two series. The solid series is our power index, plotted on the left log scale. The dashed series, plotted on the right inverted scale, is the forward annual nominal total returns on the S&P 500, projected twelve years ahead. For convenience, the chart shows the historical mean of the power index (=100), one standard deviation below and two standard deviations above it and the last four MBMs (shaded).
The bottom left of the chart
lists Pearson correlation coefficients for different periods. In general, the
correlation between capitalized power and future returns is weaker before 1929
than after. The relevant period for comparison, though, is 1953-2004 – the
years covered by Hussman’s model in Figure 4. For this period, the correlation
in Figure 6 is –0.85, only a bit lower than Hussman’s –0.93 (which is to be
expected, given the additional contribution of the ![]() factor).
factor).
Irrationality, Risk and Return (Reconsidered)
So the difference between the mismatch and power indices is not empirical but theoretical, and here we should return to the two points raised at the end of the previous section: the issue of irrationality and the relationship between risk and return.
Begin with irrationality. If capitalists and analysts were perfectly rational and fully prescient, the four-component element on the right-had side of Equation 3 would be a fixed number, market capitalization would fluctuate in tandem with gross value added and Hussman’s mismatch index would trace a straight horizontal line equal to the index’s historical mean. This is what a perfectly matched world should look like.
But that is not what we see in practice. Looking at the power index in Figure 6 – which, as we have seen in Figure 5, is nearly a carbon copy of Hussman’s mismatch index – we see that fewer than 15 per cent of the observations are equal to the index’s normalized mean of 100. The rest are either bigger or smaller. In other words, from the viewpoint of the mismatch thesis, the market is, by and large, economically irrational. Moreover – and here we come to the key point – the irrationality is almost always blamed on different forms of power, from asymmetric information and policy mistakes to market imperfections and extra-economic interventions. But then, if valuation is almost always out of tune and its deviations are mostly a matter of power, why not put aside irrationality and distortions and focus directly on what everyone seems to agree matters the most – namely power? Once the focus shifts to power, there is nothing to match and therefore no mismatch. And with the mismatch gone, there is no longer anything irrational about the valuation index going up and down. Its movements simply reflect the changing landscape of power.
The second difference has to do with risk and return. As noted, the annals of finance stipulate that risk and return should be positively correlated – yet, according to both the mismatch and power models, their correlation is in fact negative. Now, while this negative correlation does not sit well with the economic underpinnings of the mismatch thesis, it is perfectly consistent with the power underpinnings of our CasP model. Just like the mismatch index, capitalized power predicts forward returns negatively: the higher the power, the lower the return. And the reason for this negative relation is twofold: (1) power is always exercised through some form of strategic sabotage (a concept to which we return below), and sabotage elicits resistance; and (2) the greater the power and sabotage, the greater the provoked resistance. Everything else being the same, it is easier for capitalists to augment their power when the power index is at one or two standard deviations below its average (like it was in the 1940s and 1980s, for example) than when the index is one or two standard deviations above it (like in the 1900s, the 1990s and now). It is this changing intensity of resistance – and the fact that resistance goes hand in hand with power – that makes our power index mean reverting, and it is this mean reversion that ascertains that risk and return will be related negatively rather than positively.
In this respect, it seems that two standard deviations above the mean is the historical asymptote, or limit, of capitalized equity power in the United States. [17] This asymptote was reached three times over the past 150 years – in the early 1900s, in the late 1990s, and now – and in the previous two times this has happened, there followed a significant reversal in the form of an MBM. In other words, when capitalized power approaches its asymptotes, capitalists have good reason to fear their very own power. And here we come to the second aspect of our model: the phenomenon of systemic fear.
6. Systemic Fear
Seven years ago, in the midst of the financial crisis, we wrote a paper in which we argued that capitalists were struck by systemic fear: that they were apprehensive not about rising interest rates or falling profit, but about the very existence of the system as they knew it. [18] We also argued that their systemic fear could be identified empirically, by looking at the co-movement of stock prices and corporate profit (Nitzan and Bichler 2009b; expanded in Bichler and Nitzan 2010).
Identifying Systemic Fear
Our logic could be summarized
as follows. Capitalization is forward-looking: according to valuation guru Benjamin
Graham, it should
discount not current profit, but the profits that will be earned in the future,
all the way to ‘eternity’ (quoted in Zweig 2009: 28). In this scheme, current variations in profit have no more
than a negligible impact on the final outcome. And indeed, if you revisit
Equation 3, you will see that capitalization in this equation depends on
the coefficient ![]() , which in turn hinges on the
average future share of profit in
, which in turn hinges on the
average future share of profit in ![]() and the average future growth
rate of
and the average future growth
rate of ![]() . Current profit does not even
appear there.
. Current profit does not even
appear there.
This ritualistic reliance on the future implies systemic confidence. It demonstrates a belief that earnings will continue to flow and that assets will always have buyers – in other words, that the system is eternal, and that the operational symbol of capitalization will dominate the world forever.
Now, imagine the very opposite situation – a setting in which capitalists lose this systemic confidence in the future and are instead struck by systemic fear. What happens when they start to hesitate? What happens when the power index is at an all-time high and capitalists become concerned that the current power architecture is unsustainable? When the chief promoters of globalization throw in the towel, saying that globalization doesn’t work? When some peripheral states drift out of their superpower orbit while others disintegrate altogether? When conventional economic predictions fail miserably and domestic policymakers seem clueless? When inequality reaches historical extremes and the underlying population simmers with discontent? When the ecosystem destabilizes and resource extraction faces exhaustion? The result of these developments is systemic fear, an apprehension that the current mode of power might crumble.
The rulers’ immediate reaction to systemic fear, though, is not capitulation, but denial: ‘What? We, capitalists, worry? Fear for our system? No way!’ But, then, to sustain this denial and retain a semblance of confidence, capitalists need evidence that they are still very much in driver’s seat, and the most readily available evidence of such control is current profit. If current profit remains high – or better still, if it continues to rise – then we, the capitalists, can remain hopeful despite the threatening future. And if our group as a whole stays hopeful, then, as individual investors, we all have good reason to hold on to and even augment our equity portfolios.
Paradoxically, then, the evidence for systemic fear lies in its very denial. We can know that capitalists have been struck by systemic fear by the fact that they effectively negate and abandon their core ritual of forward-looking capitalization; and we can know the degree to which they negate this ritual by the extent to which their asset pricing comes to depend on current rather than future earnings.
In our earlier work we used this empirical proof-by-negation to argue that there were two periods during which capitalists were struck by systemic fear: the 1930s and the 2000s (Nitzan and Bichler 2009b; Bichler and Nitzan 2010). We demonstrated our argument in three steps: first by plotting the annual rates of change of equity prices and current earnings per share (EPS) smoothed as three-year trailing averages; then by visually comparing the co-movements of these rates of change; and finally by identifying the 1930s and the 2000s as the only two periods in which the two rate-of-change series seemed tightly correlated. [19] Unfortunately, though, our method was not very rigorous, and that lack of rigor caused us to make a serious empirical mistake: we failed to identify two additional periods in which the series were positively correlated, and this failure incited a heated debate in the Journal of Critical Globalization Studies (Kliman, Bichler, and Nitzan 2011).
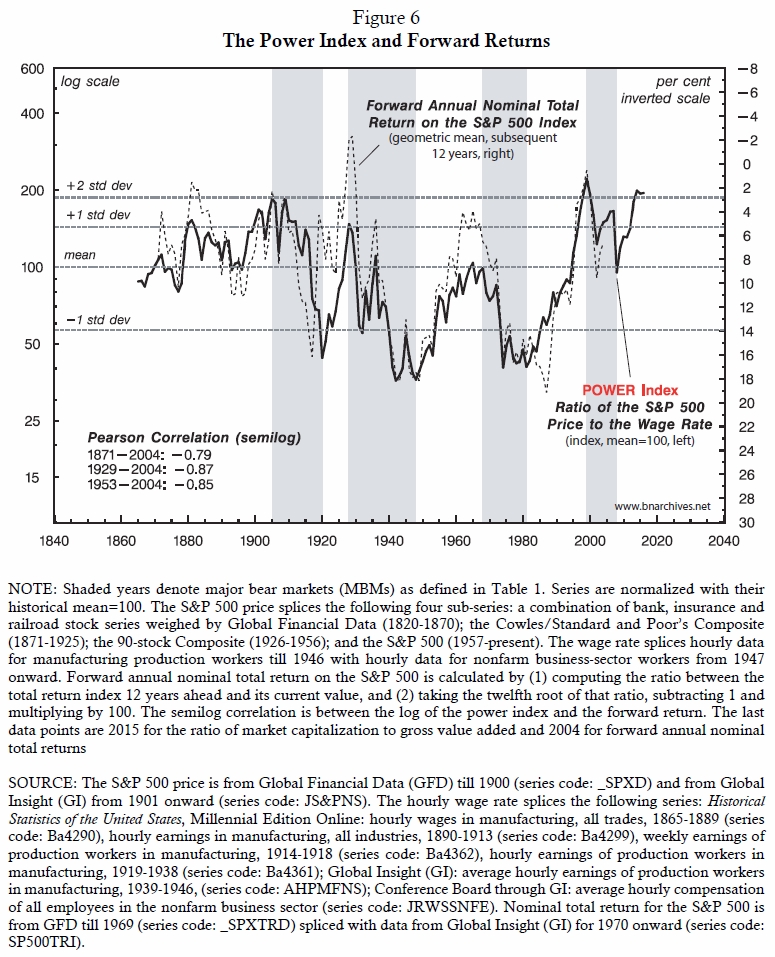
The Systemic Fear Index
So here we try to do things differently. First, we look not at the rates of change of stock prices and EPS, as we originally did, but at their levels. Measures of correlation already reflect change, so to correlate rates of change is akin to looking at the second instead of the first derivative. Second, we shorten the window of comparison between price and current EPS. Our original three-year window was probably far too long for short-sighted capitalists, so here we reduce it to twelve months. Third and finally, instead of merely eyeballing the correlation window between the rates of change of stock prices and EPS, we measure it systematically as it drifts over the entire dataset. [20]
The result of these modifications is displayed in Figure 7. The top panel of the chart shows normalized monthly price and EPS data for the S&P 500 group of companies, dating back to 1871. The bottom panel plots short-term correlations. The thin series in the bottom panel measures the 12-month trailing correlation between the price and EPS series shown in the top panel. Each observation shows the correlation over the past year, with a value ranging between –1 (perfect inverse correlation) and +1 (perfect direct co-movement).
The difficulty with the thin 12-month trailing correlation is that it oscillates widely, so visual inspection alone is not very revealing here. The thick series in the bottom panel addresses this difficulty by smoothing the thin series as a 10-year trailing average. Each observation in the thick series measures the average 12-month trailing correlation between price and EPS over the previous ten years. We call this series the systemic fear index. [21]
The Historical Evolution of Systemic Fear
Figure 8 enlarges our systemic fear index taken from the bottom panel of Figure 7, making it easier to examine. The chart shows two clear patterns: one long term, the other shorter term. The long-term pattern has a V-shape, with the early 1990s as its low point. Until the early 1920s, forward-looking capitalization was still in its infancy, so the correlation between price and EPS was pretty high, hovering around +0.4. But even then there was already a visible down drift, and by the early 1940s this down drift had turned into a sharp decline. Discounting methods were now making their way into introductory textbooks, and by the 1950s, with the capitalization ritual becoming more widely accepted and increasingly internalized by equity investors, the correlation fell to around zero and from then onwards continued to hover around this value – albeit with some significant oscillations. The decisive reversal came only in the early 1990s. Initially, the uptick looked like part of yet another short oscillation. But by the early 2000s it became evident (at least in retrospect) that the century-long downtrend had been broken. Instead of reverting back to zero, the systemic fear index continued to soar and, by the early 2010s, reached an all-time high of +0.6.
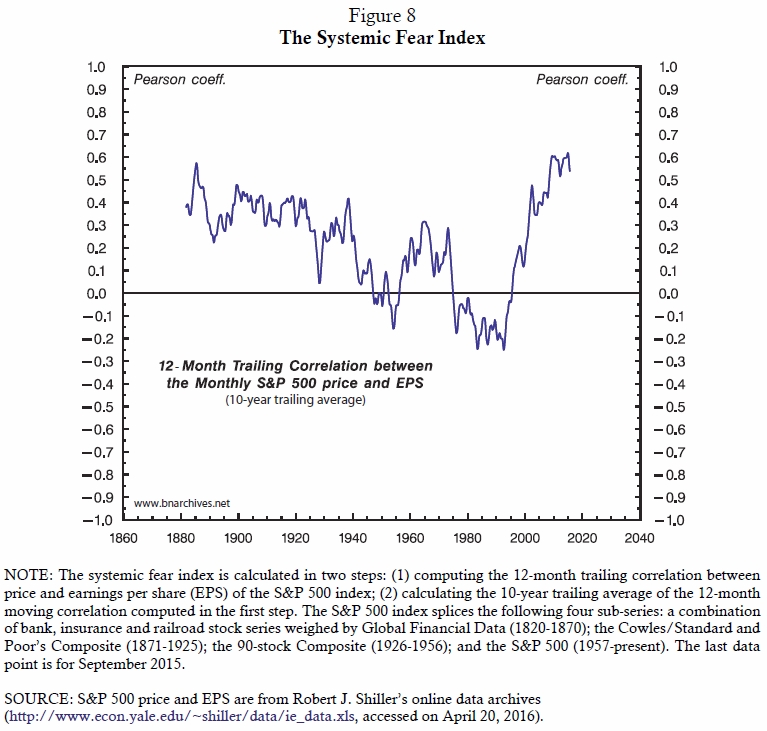
This V-shape pattern, though, has been anything but smooth. Oscillating around the long-term down- and uptrends we can see plenty of shorter-term fluctuations, some of which are pretty pronounced. So the question we need to address is what lies behind these patterns: what determines the long-term V-shape of the index and what accounts for its shorter-term fluctuations?
Culture or Power?
To the best of our knowledge, this question has never been asked, let alone answered. Indeed, as far as we know, the V-shape pattern of the short-term price-EPS correlation shown in Figures 7 and 8 is a new finding.
It is common to argue that, since the 1980s, U.S. capitalism has been marked by a growing emphasis on ‘shareholder value’, heightened ‘short-termism’ and a nearly universal obsession with quarterly increases in profit. This popular view is certainly consistent with the post-1980s surge of the price-EPS correlation shown in Figure 8 – and this consistency should hardly surprise us. With capitalists paying more and more attention to the latest bottom line and analysts glued to the latest bit of news, it is no wonder that equity markets have become increasingly sensitive to the most recent variations in earnings.
But what is the cause of these changes? Why has the capitalist time horizon shrunk? Why have investors who, for a whole century up until that point, cared less and less about current earnings and often seemed perfectly happy to buy and hold stocks for the long haul, suddenly started to insist on quarterly increases in profit? Is the V‑shape reversal of the early 1990s merely the consequence of a changing ‘investment culture’? Is it simply a new fad imprinted by the theoretical winds of just-in-time neoliberalism and emboldened by the ideological flare of Margaret Thatcher, Ronald Reagan and Alan Greenspan – or are these developments themselves the result of a deeper change?
The evidence presented below suggests the latter. Present-day capitalists and analysts, we argue, have come to demand quarterly increases in profits not because they started to ‘feel like it’, because they were taken over by a new financial ‘fashion’ or because they were somehow convinced that short-term increases are more ‘economically efficient’ than long-term growth. In our view, they do so because they are compelled to, and the force that compels them has nothing to do with any of the above: their capitalized power is approaching its asymptotes, and the only way for them to counteract their deepening systemic fear is by pushing for higher current earnings.
The Co-Movement of Capitalized Power and Systemic Fear
The long-term relationship between systemic fear and capitalized power is shown in Figure 9. The chart displays two series. The dotted blue series, plotted against the right scale, is our systemic fear index, taken from Figure 8. To reiterate, this index is the 10-year trailing average of the 12-month trailing correlation between the S&P 500 price and EPS. The solid black series, plotted against the left log scale, is our power index, which we take from Figure 6 and smooth as a 10-year trailing average to match the periodicity of the systemic fear index.
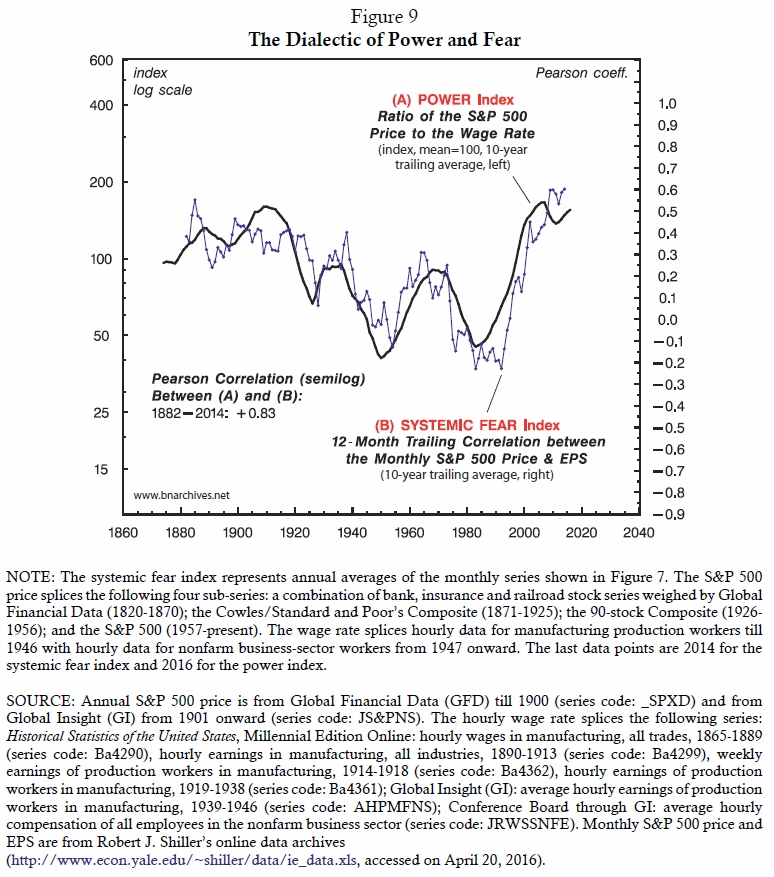
The correlation between the two series is extremely tight: its Pearson coefficient for the past 132 years is +0.83 out of a maximum of +1. What this correlation tells us is that the greater the capitalized power of equity owners relative to the underlying population, the greater their systemic fear and therefore the greater their reliance on current earnings when pricing their stocks – and conversely, the lesser their capitalized power, the lower their systemic fear and hence the weaker their emphasis on present profit.
The Dialectic of Power and Fear
At first sight, this co-movement might seem counterintuitive. Why should capitalists fear more for their system as they grow more powerful? Shouldn’t it be the other way around – i.e., the greater their power, the lesser their systemic fear?
To answer this question, we need to backtrack a bit. Power is a complex and often slippery concept. It has numerous dimensions and layers, it is historically contingent and context-dependent and, most importantly, it is deeply dialectical and self-transformative. In our own research, we extend Johannes Kepler’s scientific notion of force to view capitalized power not as a stand-alone qualitative entity, but as a quantitative relationship between entities (Nitzan and Bichler 2014: 141). In the present paper, we define this power very broadly as the relationship between equity owners and the underlying population, quantified by the ratio of stock prices to the wage rate. But we also argue that the quantity of capitalized power expresses the rulers’ confidence in the obedience of the ruled (Nitzan and Bichler 2009a: 17) – which in our case here denotes the confidence of equity owners in the obedience of the underlying population.
Confidence in obedience, though, is not a monolithic sentiment. If we are to generalize, we might say that the buildup of power generates not one, but two movements – one extroverted, the other introverted – and that the trajectories of these two movements are not similar but opposite. On the outside, the relationship appears positive: the greater the rulers’ power, the greater their display of confidence in obedience. But on the inside, the connection is negative: the more powerful the rulers, the greater their fear that their power might crumble.
This double-sided relationship is the linchpin of Hobbes’ Leviathan (1691). The relatively equal abilities of human beings, he says, breed their uncertainty, insecurity and mutual suspicion, and these forces in turn compel them to try to increase their differential power without end. But, then – and this is the crucial qualifier – the more power one possesses, the more he or she dreads losing it all. The result is an ongoing cycle, with fear stoking a hunger for power, and the amassment of power heightening the very fear that begot that hunger in the first place (for example, pp. 75 and 94).
Now consider how this double movement unfolds in our case here. Capitalists, we posit, are driven to increase their capitalized power without end, and this increase, we maintain, boosts their expressed confidence in obedience. And how do we know that their confidence in obedience is indeed rising? Because the stock prices comprising the numerator of the power index are determined by the capitalists themselves, and because capitalists determine those prices by risking the thing they cherish the most: their own money. Indeed, the only reason for capitalists to buy stocks and in so doing bid up the stock price/wage ratio is that they expect this ratio to rise even further. And the fact that they believe that this ratio will go up attests to their confidence in obedience – the confidence that the underlying population will not expropriate them and that the system as a whole will not fail them. In this sense, our power index offers an objective measure of capitalist confidence – at least on the outside.
But as Figure 9 shows, there is another, inner process at work here: the temporal basis for capitalist confidence in obedience varies with the level of capitalized power. When the power index is low, the projected confidence of capitalists is inherently forward-looking. During such periods – for example, the 1940s or the 1980s – capitalists focus on the future and ignore present profit altogether (as indicated by the low, zero or even negative price-EPS correlation). And why? Because the lower the capitalized power, the greater the scope for increasing it further: income can be further redistributed in favour of profit, hype can be further amplified, profit volatility can be further decreased and the discount rate can be further lowered. And as long as these elements can be further augmented/reduced in favour of capital, owners can safely ignore the dismal present and focus on the promising future.
However, when the power index is high – as it was, for example, during the early twentieth century, and as it is now, at the beginning of the twenty-first – confidence in obedience has to rely largely on the present (and it does – as indicated by the high price-EPS correlation during these periods). And why? Because capitalized power is not unbounded. The greater the power, the greater the resistance to power. And when power approaches its asymptotes – in this case, when the profit share of income and the level of hype are already high and income volatility and the normal rate of return already low – increasing it further within the existing confines of the ‘symbolic machine’, as Ulf Martin (2010) calls it, becomes harder and harder. [22] Such increases require further threat, sabotage and open force, which in turn make the system ever more complex and increasingly brittle, and hence prone to breakdown (Bichler and Nitzan 2010). Under these circumstances, the only way for capitalists to retain their apparent confidence is to be constantly reassured that the system still holds here and now. And since the future is too bleak to rely on, this reassurance can come only from current profit.
The Omen
Rulers always need an omen, a self-serving looking glass to bolster their confidence and galvanize their resolve. But sometimes the omen refuses to cooperate, and when it disobeys, the façade crumbles and the rulers find themselves facing the void. Literature offers many illustrious examples: the evil queen in the Brothers Grimm’s Little Snow-White, whose obedient magic mirror suddenly defies her, declaring that she is not the fairest of all; Genghis Khan in Aitmatov’s The Day Lasts More than a Hundred Years (1983), whose loyal guiding cloud suddenly disappears, leaving the Khan’s globetrotting conquest in tatters; Belshazzar, the omnipotent king of Babylon, whose hubris is suddenly deflated by a mysterious writing on the wall (Book of Daniel: Ch. 5); the list goes on.
These power mirrors, though, are pretty naïve. They typically generate no more than a binary image, and their warnings almost always come too late. By contrast, the stock price-EPS correlation offers an infinitely nuanced reflection. Instead of a binary image, it draws a continuous scale, ranging from a Pearson coefficient of 0 (or less), which indicates that forward-looking capitalists do not fear for their system, to a Pearson coefficient of +1, which means that capitalists, struck by systemic fear, have abandoned their core belief in forward-looking capitalization in favour of a defensive, backward-looking posture.
This analytical range is shown historically in Figure 10. The chart presents the same data series from Figure 9, but instead of displaying them on a time scale, it plots them against one another. Each annual observation projects two readings: the 10-year trailing average of the power index on the horizontal scale, and the systemic fear index on the vertical scale. The observations are tightly clustered around a positive slope, reconfirming what we have already seen in Figure 9 – namely, that capitalized power is closely intertwined with systemic fear. For illustration purposes, we use a dashed red line to trace the evolution of this temporal relationship during the most recent period: from 1983, when the systemic fear index was at a record low, to 2014, when it reached its all-time high.
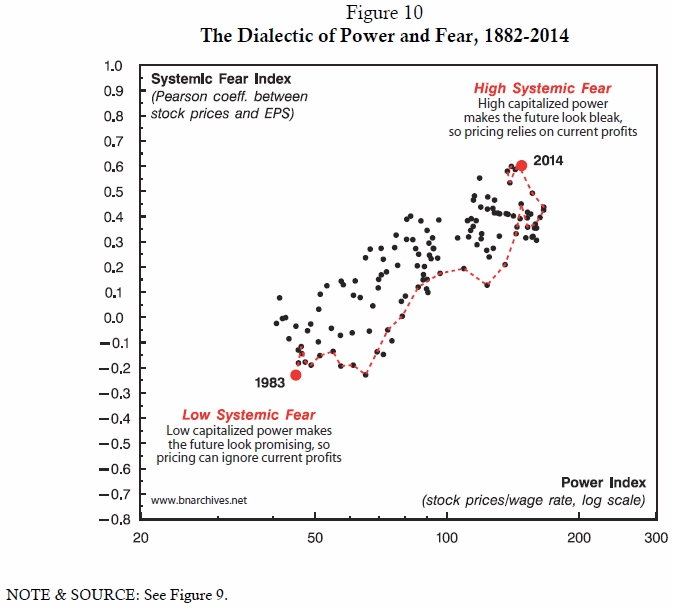
The gradual temporal ‘stretching’ of this dashed line has been akin to pulling a string: as the United States moved up and to the right on this path, the tension between sabotage and resistance kept rising and rising. However, because the process has been so slow and drawn out, initially this buildup was largely imperceptible. Indeed, until recently the key ‘actors’ themselves – i.e., the capitalists and fund managers, along with policymakers and opinion shapers – remained largely unware of it and seldom admitted it, not even to themselves (and rarely if ever in the manner described here). But as Veblen might have put it, although they are yet to recognize it with their mind, they already know it in their heart. And here their actions speak louder than words: with their power rising, they have gradually but systematically abandoned their sacred ritual of forward-looking capitalization in favour of the still-rosy present. Their current mode of power is becoming increasingly unstable, and their short-term equity pricing indicates that underneath the hubris lies a deepening apprehension that it might not last.
Our own study of redistribution as the key power axis of capitalism started during the early 1980s. At the time, U.S. capitalized power and systemic fear were at all-time lows, investors were totally oblivious to the issue and our work was typically classified as ‘social economics’ (with an aftertaste of moralizing ‘social justice’). But as capitalized power and systemic fear increased, the crucial importance of redistribution slowly percolated to the surface, and in 2014, when power and fear reached record highs, Thomas Piketty’s work on inequality (Piketty 2014) was suddenly made top news and everyone suddenly knew (all along) that the top 1 per cent held the rest of the world under its thumb.
And then the discourse started to change. Although the talking heads still hail capitalism as the best of all possible worlds, we now begin to see more and more expressions of guilt (the IMF admitting that the project of neoliberal globalization has been 'oversold'; Ostry, Loungani, and Furceri 2016), remorse (McKinsey cautioning that the current generation is poorer than its parents; McKinsey & Company et al. 2016) and dire warnings (former bond king Bill Gross alerting his fellow capitalists that, although ‘I’m an investor that ultimately does believe in the system’, I believe that ‘the system itself is at risk’; Gittelsohn 2016). With tension remaining at an all-time high, many savvy investors sense that sooner or later the spring will snap, and as confidence crumbles and the rulers run for the stock-market doors, a new MBM will get under way.
The Temporal Basis of Confidence in Obedience
In sum, we can say that the power and systemic fear indices tell us two opposite things about the capitalist outlook: the power index expresses the capitalists’ outer confidence in obedience, while the systemic fear index indicates the inner capitalist apprehension that the mode of power might not last. Although they point in different directions, though, the two measures are intimately intertwined: the systemic fear index shows the temporal basis of capitalist confidence. When power is low, confidence is based on the future and relies on forward-looking capitalization. But as power rises, the basis of confidence shifts to the present – and this shift, which implies a growing reliance on current profit, spells the progressive breakdown of forward-looking capitalization and a deepening fear for the system’s future.
7. Strategic Sabotage
This discussion leads us to the third aspect of our triangular CasP model: the claim that capitalized power and systemic fear are both driven by strategic sabotage. [23]
Is the Stock Market Pro-Cyclical or Countercyclical?
Needless to say, this claim is diametrically opposed to the mismatch thesis. The dominant view is that financial markets oscillate around their economic fundamentals and that the oscillation is pro-cyclical. The stronger the fundamentals, the greater the optimism and therefore the larger the overshooting – and conversely, the weaker the fundamentals, the deeper the pessimism and therefore the greater the undershooting. This is why market ‘bubbles’ are supposed to inflate when the economy is booming and deflate when it tanks.
Now, in our own work we have shown that, more often than not, the stock market is not pro-cyclical. As Figures 9 and 10 demonstrate, stock prices oscillate together with current profit only when the market is very ‘expensive’ (i.e., when capitalized power is extremely high). When valuations are average, low or very low – which is the case most of the time – the movements of price and current profit are largely unrelated. Moreover, as we have demonstrated in our previous analyses of the mismatch thesis, the long-term growth rates of ‘financial capital’ (stocks and bonds) and the ‘real capital stock’ (measured in current dollars) correlate not positively but negatively (Bichler and Nitzan 2009, 2015a). What we would like to argue here is that this counter movement of the stock market and the so-called underlying economy reflects the sabotage underpinnings of accumulation.
Employment Growth
Begin with Figure 11. The chart shows two series. The first is our power index, smoothed as a 10-year trailing average and plotted against the left log scale. The second is the annual growth rate of employment, which is also smoothed as a 10-year moving average, and which we plot against the right scale. Notice that the employment growth series is lagged five years. This lag means that, if there is a connection here, this series can be seen as a leading indicator or predictor of the power index.

The reason we focus on employment growth is that it is a meaningful proxy from both the mismatch and power perspectives. From a mismatch viewpoint, employment growth is a direct measure of economic activity (unlike GDP growth, which is the outcome of that activity). From a power perspective, employment growth is an inverse proxy of strategic sabotage: it is one of the most crucial metrics of the wellbeing and sense of security of the underlying population, so to lower this proxy is to strategically sabotage most people. [24]
Switching the Social Current
Now, the thing that jumps out of the chart here is the remarkable 1939 reversal of the relationship between the two indices: until 1939, employment growth and the power index were positively correlated – and then, suddenly, as if someone switched the social current, the relationship turned negative.
How is such overnight reversal even possible? The answer to this question requires much more research than we can offer here, but let us outline our own initial thinking about it. Recall that the 1930s experienced an MBM, and that this MBM was ultimately resolved by creordering the entire mode of power. The chief hallmark of this creordering was the rise of the Keynesian welfare-warfare state. And one of the key pillars of Keynesianism was discretionary countercyclical economic policy – and specifically for our purpose here, countercyclical monetary policy. In our view, this dramatic shift toward discretionary countercyclical monetary policy might explain why the correlation between capitalized power and strategic sabotage suddenly inverted.
Employment Growth and Monetary Policy
Let us examine this hypothesis a bit more closely. Until 1939, the power and employment growth indices were tightly and positively correlated (recall that employment growth is an inverse proxy of sabotage). The reason was twofold. First, capitalized power and systemic fear, although declining, were still relatively high, so changes in stock prices moved closely with changes in current earnings, and therefore with changes in employment (profit and employment levels are positively correlated). Second, since there was no countercyclical monetary policy, this positive correlation was largely undisturbed.
After 1939, though, capitalists started to expect government policy to mitigate the cycle, in part through countercyclical monetary policy. And since the cycle is driven by employment growth, they expected higher employment growth to bring about tighter money, higher interest rates and therefore lower capitalization. This expectation took a bit to materialize, but as Figure 12 shows, eventually it became self-fulfilling.
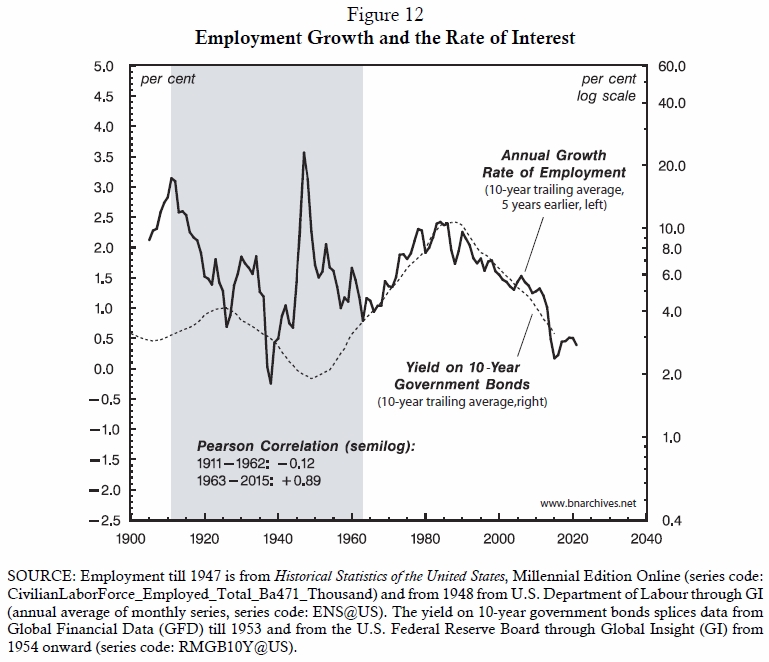
The chart shows two series: the annual rate of growth of employment plotted against the left scale and the yield on 10-year government bonds on the right. We can see that, until the middle of the twentieth century, there was little or no connection between the two series (Pearson coefficient of –0.12). But from the early 1960s onward, employment growth has been a nearly perfect five-year leading predictor for interest rates: the lower the rate of growth of employment (and therefore the greater the strategic sabotage), the lower the subsequent rate of interest (with a Pearson correlation of +0.89). And since lower interest rates boost capitalization, you can clearly see how strategic sabotage worked to fuel capitalized power.
From a Political Business Cycle to a CasP Policy Cycle
During the early 1940s, Michal Kalecki wrote an important article in which he identified what he called the ‘political business cycle’ (Kalecki 1943). The business cycle, he argued, had been deeply politicized in more than one way, and was now increasingly driven by government policy. One of Kalecki’s main points was that expansionary policy boosts employment and wages as well as profits, and therefore serves the economic interests of both workers and capitalists. But the efficacy of such policy demonstrates that governments can replace capitalists in generating and maintaining prosperity, and that demonstration undermines the long-term political interest of capitalists in preserving their class rule. According to Kalecki, this contradiction between the economic and political interests of capitalists means that, when it comes to maintaining full employment, capitalists are likely to sacrifice their economic interest in higher profit for their political interest in continued dominance.
However – and here we come back to our own model – if we think of capital accumulation not as an economic activity, but as the capitalization of power, there is no sacrifice at all. The consequence of tighter policy may be lower employment growth and lower profit here and now – but, then, under normal circumstances, these short-term consequences have little or no bearing on forward-looking capitalization. At the same time, while the immediate consequences of the policy in terms of employment and profit have little bearing on capitalization, the tools of the policy – and particularly the rate of interest – have a huge impact. As Figures 11 and 12 indicate, intensified sabotage through lower employment growth has become a leading indicator for lower interest rates down the road, and lower interest rates boost capitalized power.
So what we end up with is not a narrow political business cycle à la Kalecki, but a broader CasP policy cycle. In this setup, the government is not some sort of exogenous distortion or an external alley but an integral component of the capitalization of power and the regulation of strategic sabotage. Moreover, there is no longer a conflict between the so-called political and economic interests of capitalists. Higher strategic sabotage keeps capitalists in the political driver’s seat. And while this sabotage may undermine current profits, it allows lower interest rates, which are far more important for the capitalization of their forward-looking power.
Finally, in order to close our triangular model, Figure 13 shows the connection between strategic sabotage and systemic fear. This chart plots our systemic fear index on the left scale and the strategic sabotage index on the right scale. As before, both series are smoothed as 10‑year trailing averages, and the strategic sabotage index is lagged five years. Note that the right scale is inverted to make the correlation easier to visualize.
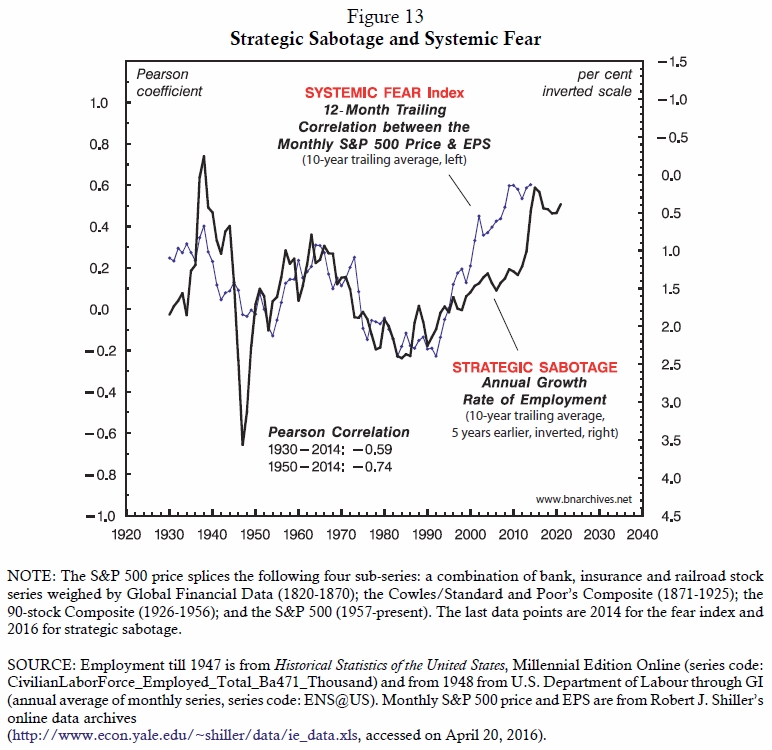
Now, we already know that, since the 1940s, higher strategic sabotage has been associated, five years later, with higher capitalized power; but as noted, strategic sabotage also elicits resistance, and resistance raises the systemic fear of capitalists – exactly what Figure 13 demonstrates.
8. Conclusion
In summary, we started with the conventional creed of the mismatch thesis, which (1) assumes that equity investors constantly try to price stocks to match the underlying economic fundamentals; (2) posits that they rarely if ever succeed in doing so; and (3) shows that their presumed failure is a superb predictor of future returns.
We then proceeded to put this view back on its feet. We outlined a triangular CasP model of the stock market, showing that (1) mismatch valuation indices are in fact driven not by economic productivity and utility, but by capitalized power; (2) capitalized power is dialectically intertwined with systemic fear; and (3) both capitalized power and systemic fear are driven by strategic sabotage. An important corollary of this model is the notion of a CasP policy cycle – the idea that government policy, insofar as it caters to the imperative of capitalized power, favours low employment growth in order to enable low rates of interest.
And that observation leads us to the
current historical moment. Over the past thirty years, U.S.-based capitalists
(and others investing in U.S. equities) have managed to increase their
capitalized power relative to the underlying population from record lows to
record highs. In our view, this increase has been driven by two related
processes: (1) a redistribution of income from non-capitalists to capitalists,
along with a growing conviction that the resulting inequality could be
maintained and even augmented in the future; and (2) mounting strategic
sabotage in the form of lower employment growth. In terms of Equation 2, the
first process meant a higher hype coefficient ![]() regarding the value of
regarding the value of ![]() . The second process has had a double impact:
on the one hand, it assisted the first process by restricting wages and
boosting profits, while, on the other, it enabled looser monetary policy and
lower interest rates, thus helping to reduce the normal rate of return
. The second process has had a double impact:
on the one hand, it assisted the first process by restricting wages and
boosting profits, while, on the other, it enabled looser monetary policy and
lower interest rates, thus helping to reduce the normal rate of return![]() (there has been no discernable decline in
earnings volatility during this period, so it is hard to draw meaningful
conclusions about risk perceptions).
(there has been no discernable decline in
earnings volatility during this period, so it is hard to draw meaningful
conclusions about risk perceptions).
These two processes were in turn underwritten by a major creordering of the underlying mode of power. Following the MBM of 1968‑1981, capital has been progressively transnationalized, leading to the gradual disempowerment of the underlying domestic populations, the lowering of corporate and personal tax rates for high-net-worth individuals, the hijacking of macroeconomic policy for capitalized ends and the cajoling-forcing of pension funds and public assets into the stock market, among others consequences. But no spring can be pulled indefinitely. Conflict-driven redistribution and lower interest rates have pushed capitalized power toward its historical asymptote, and this approach means that the United States – and maybe the world as a whole – is now facing a historical crossroad.
Looking forward, we can see two possible
trajectories. The less likely of the two is some version of Jack London’s The
Iron Heel (1907), in which
the U.S. ruling class breaks through its historical asymptote by imposing a mode
of power much harsher than the one prevailing over the past two centuries. To
sustain this new mode of power, the rulers would have to further redistribute
income in their favour, domestically and/or globally, leading to historically
unprecedented levels of inequality. Moreover and crucially, they would have to
cast this greater inequality as the ‘new normal’ (i.e., raise ![]() in Equation 2) as well as persuade
investors that this greater inequality is here to stay (so as to prevent hype
in Equation 2) as well as persuade
investors that this greater inequality is here to stay (so as to prevent hype ![]() from collapsing). And while doing all of that,
they would also need to keep interests rates and profit volatility low in order
to prevent the discount rate from rising significantly – a tall order in a
world marked by greater sabotage, intensified violence and therefore greater
instability.
from collapsing). And while doing all of that,
they would also need to keep interests rates and profit volatility low in order
to prevent the discount rate from rising significantly – a tall order in a
world marked by greater sabotage, intensified violence and therefore greater
instability.
The other, and in our view more likely, possibility is that history will repeat itself, and that, sooner or later, the United States will experience another MBM. Now, if the past offers any guidance here, getting out of this MBM would require a major creordering of capitalism, domestically and globally, including the role of governments in the capitalization process. And here we come to our final and perhaps most important point.
Should it occur, this creordering is likely to unsettle the dominant dogma, and that unsettling might open a brief historical window for critical alternatives – new theories, novel experiments in public planning and radical proposals to undo capitalized power in favour of direct democracy and autonomy (for our own modest proposal on this issue, see Debailleul, Bichler, and Nitzan 2016). However, if these alternative theories, experiments and policies are to have any traction, they must transcend the conventional fracturing of capitalism. They have to overcome the outdated notions that capitalism is a mode of consumption and production counted in utils or socially necessary abstract labour time; that politics is distinct from and ‘distorts/assists’ the economy, as the case may be; and that finance is somehow a mismatched reflection of an underlying ‘real’ economy. To stick to these preconceptions is to stay locked within the capitalist mindset. And if we remain locked in this mindset, we are bound to find ourselves, once the MBM has come and gone, in a new, capitalist-creordered version of the very same system.
Endnotes
[1] This paper was presented at the fourth CasP conference, ‘Capital as Power: Broadening the Vista’ (York University, September 28-30, 2016). Shimshon Bichler teaches political economy at colleges and universities in Israel. Jonathan Nitzan teaches political economy at York University in Canada. All of their publications are available for free on The Bichler & Nitzan Archives. Work on this paper was partly supported by the SSHRC. The paper is licenced under Creative Commons (Attribution-NonCommercial-NoDerivs 4.0 International)
[2] The theory of capital as power posits that capitalism is best understood not as a mode of consumption and production, but as a mode of power, and that capital is not machines or labour time, but the central power institution of capitalism. For readers new to the subject, Bichler and Nitzan (2012b) provides a short summary of CasP, Nitzan and Bichler (2009a) offers an extended articulation and Bichler and Nitzan (2015c) brings together a collection of recent articles. The past, present and future of the CasP project, including an extensive bibliography, are outlined in Bichler and Nitzan (2015b).
[3] It is of course true that many practical investment models – such as those based on momentum, quantitative analysis and index tracking, among other rituals – do not rest directly on the valuation of economic fundamentals. But all of them assume that, in the final analysis, capitalization mirrors and must eventually converge to these fundamentals. For bestselling manuals on valuation, see Damodaran (2011, 2012), McKinsey & Company et al. (2005) and McKinsey & Company et al. (2011).
[4] Much of economics is conceived, theorized, measured and written in ‘real terms’. We enclose this concept in inverted commas because, in our view, it is deeply problematic both philosophically and empirically (see for example Nitzan 1989; Nitzan and Bichler 2009a: Ch. 8).
[5] The term ‘util’ was invented by Irving Fisher (1892). Since this unit is totally fictitious and impossible to measure, contemporary mainstream economists pretend it to be theoretically unnecessary. In practice, though, they conveniently forget this pretention and use the util in pretty much everything they do. The reason for this organized, church-like hypocrisy is simple: the only way for economists to compute real economic aggregates (like real GDP and the real capital stock) or real economic ratios (such as those comparing the purchasing power parity or productivity of different economic agents) is to assume a universal unit of measurement; and in the hedonic world of economics, the only universal unit of measurement is the fictitious util (Nitzan 1992: Ch. 5; Nitzan and Bichler 2009a: Chs. 5 and 8).
[6] The geometric growth rate is derived by taking the ratio between the last and first observation, raising this ratio to the power of 1/n (with n = number of years in the series less one), subtracting one and multiplying the result by 100.
[7] For the genesis, earlier versions and prior analyses of this concept, see Bichler and Nitzan (2008), Kliman, Bichler and Nitzan (2011), and Bichler and Nitzan (2012a).
[8] The verb-noun ‘creorder’ fuses the dynamic and static aspects of creating order (Nitzan and Bichler 2009a, especially Ch. 14). The word ‘nomos’ was used by the ancient Greeks to denote the broader social–legal–historical institutions of society (Castoriadis 1984, 1991). The capitalist nomos is explored in Nitzan and Bichler (2009a: Ch. 9).
[9] According to Irving Fisher, ‘The statement that “capital produces income” is true only in the physical sense; it is not true in the value sense. That is to say, capital-value does not produce income-value. On the contrary, income-value produces capital value. . . . [W]hen capital and income are measured in value, their causal connection is the reverse of that which holds true when they are measured in quantity. The orchard produces the apples; but the value of the apples produces the value of the orchard. . . . We see, then, that present capital wealth produces future income-services, but future income-value produces present capital-value’ (1907: 13-14, original emphases). For a critical assessment of Fisher’s framework, see Nitzan and Bichler (2009a: 170-172).
[10] Although we do not pursue the following argument in our paper here, we should note that capitalization can neither match nor mismatch the so-called real capital stock, and for the simplest of reasons: this stock does not – and cannot – have a definite quantity to start with. As it stands, the capital stock comprises various entities, such as machines, structures, raw materials and (some say) knowledge, yet these entities have no common unit with which they can be aggregated into a single magnitude (recall that the universal util is a theoretical and empirical fiction – see footnote 5). This impossibility was first pointed out by Veblen and Wicksell at the turn of the twentieth century, demonstrated by the Cambridge Capital Controversies of the 1950s and 1960s, and reluctantly confirmed by the leading lights of mainstream economics shortly thereafter. However, since accepting this conclusion would have pulled the rug from under the entire edifice of economics, economists continue to insist that capital does have a ‘real’ quantity and that their discipline, although based on a logical-empirical impossibility, is still a science (for critical summaries, see Harcourt 1969, 1972; Nitzan and Bichler 2009a: Chs. 5 and 8; Hunt and Lautzenheiser 2011: Ch. 16).
[11] Hussman’s own model uses monthly data, whereas our reproduction here employs annual data. The model’s rationale, underlying assumptions and technical specifications are provided in Hussman (2015a, 2015b). Hussman’s articles are archived here: http://www.hussmanfunds.com/weeklyMarketComment.html.
[12] Hussman’s decision to focus on non-financial corporations rather than all corporations is not theoretical, but practical: the former cluster offers slightly better predictions than the latter.
[13] Hussman’s position on this issue is not entirely clear. On the one hand, he repeatedly alerts his readers that extremely overvalued stocks represent a toxic combination of maximum risk and minimum return (see, for instance, 2000, 2016). On the other hand, as far as we can tell, he keeps silent on why this theoretically awkward risk/return profile should exist in the first place.
[14] The notion of ‘capital as power’ as an operational symbol was first suggested and elaborated by Ulf Martin (2010). Following Sybille Krämer, Martin distinguishes between three types of symbols: magical (the entity is the symbol), ontological (the symbol represents a distinct worldly entity), and operational (the symbol defines the entity). According to Martin, capital as power, because it defines its own logic as well as creates and recreates the social reality, is best understood as an operational symbol.
[15] Historically,
the ![]() has
trended downward while the
has
trended downward while the ![]() has
trended upward. Moreover, the two movements have more or less offset each
other, so their product – the
has
trended upward. Moreover, the two movements have more or less offset each
other, so their product – the ![]() in
Equation 11 – has ended up moving sideways, showing little or no
correlation with the mismatch and power indices.
in
Equation 11 – has ended up moving sideways, showing little or no
correlation with the mismatch and power indices.
[16] For a succinct comparison between the old geocentric model and its heliocentric alternative, see Singh (2004, particularly Table 2, pp. 34-35).
[17] For different analyses of the asymptotes of power, see Bichler and Nitzan (2012a), Kliman, Bichler and Nitzan (2011) and Bichler and Nitzan (2014).
[18] ‘For this consciousness [of the capitalist bound to the steering wheel of a megamachine gone wild] was not in peril and fear for this element or that [such as falling profit or rising volatility], nor for this or that moment of time [like a sharp market correction or a declaration of war], it was afraid for its entire being; it felt the fear of death, the sovereign master [the ultimate wrath of the ruled]. It has been in that experience melted to its inmost soul, has trembled throughout its every fibre, and all that was fixed and steadfast has quaked within it [will capitalism survive?]’ (Hegel 1807: 237; paraphrased in Bichler and Nitzan 2010: 19).
[19] Strictly speaking, the term ‘current’ earnings per share is a misnomer: in practice, EPS data are reported as the average earnings per share recorded over the previous twelve months. In this sense, all current earning data are in fact backward-looking.
[20] The use of a moving correlation here was suggested and empirically demonstrated by Ulf Martin (private communication with the authors, May 2014).
[21] For example, the systemic fear index for September 2015 (the last observation in the series) is +0.538. This result is derived by averaging out the 120 monthly readings of the 12-month trailing correlations between August 2005 and September 2015.
[22] Bichler and Nitzan (2012a) examine some of these limits in the United States.
[23] The concept of strategic sabotage – the idea that rulers dominate society by strategically undermining, limiting and redirecting to their own ends the community’s autonomy, creativity and productivity – was first articulated by Thorstein Veblen (Cf. 1904, 1923). This concept is central to our work on the capitalist mode of power (Nitzan and Bichler 2009a: Ch. 12) and has been examined, researched and extended in numerous CasP publications (for an outline of works on the subject, see Bichler and Nitzan 2015b).
[24] The inverted growth rate of employment, although central, is not the only form of sabotage (see footnote 23). Many other processes serve to undermine the wellbeing and security of the underlying population – though incorporating them into our indicator might end up being a double-edge sword. While sharpening the analysis, they will likely make the indicator more complex, shorter in duration and difficult to apply in other countries.
References
[Most CasP-related publications are available for free from The Bichler & Nitzan Archives (http://bnarchives.net) and Capital as Power (http://capitalaspower.com).]
Bichler, Shimshon, and Jonathan Nitzan. 2008. Contours of Crisis: Plus ça change, plus c'est pareil? Dollars & Sense, December 29.
Bichler, Shimshon, and Jonathan Nitzan. 2009. Contours of Crisis II: Fiction and Reality. Dollars & Sense, April 28.
Bichler, Shimshon, and Jonathan Nitzan. 2010. Systemic Fear, Modern Finance and the Future of Capitalism. Monograph, Jerusalem and Montreal (July), pp. 1-42.
Bichler, Shimshon, and Jonathan Nitzan. 2012a. The Asymptotes of Power. Real-World Economics Review (60, June): 18-53.
Bichler, Shimshon, and Jonathan Nitzan. 2012b. Capital as Power: Toward a New Cosmology of Capitalism. Real-World Economics Review (61, September): 65-84.
Bichler, Shimshon, and Jonathan Nitzan. 2014. No Way Out: Crime, Punishment and the Limits to Power. Crime, Law and Social Change. 61 (3, April): 251-271.
Bichler, Shimshon, and Jonathan Nitzan. 2015a. Capital Accumulation: Fiction and Reality. Real-World Economics Review (72, September 30): 47-78.
Bichler, Shimshon, and Jonathan Nitzan. 2015b. The CasP Project: Past, Present, Future. Working Papers on Capital as Power (2015/04, December): 1-29.
Bichler, Shimshon, and Jonathan Nitzan. 2015c. The Scientist and the Church. World Economics Association Books: WEA.
Debailleul, Corentin, Shimshon Bichler, and Jonathan Nitzan. 2016. Theory and Praxis, Theory and Practice, Practical Theory. Working Papers on Capital as Power (2016/01, February): 1-13.
Fisher, Irving. 1892. [1965]. Mathematical Investigations in the Theory of Value and Price. Appreciation and Interest, 1896. New York: A.M. Kelley.
Fisher, Irving. 1896. What is Capital? The Economic Journal 6 (24, December): 509-534.
Fisher, Irving. 1907. The Rate of Interest. Its Nature, Determination and Relation to Economic Phenomena. New York: The Macmillan Company.
Gittelsohn, John 2016. Gross Trying to Short Credit to Reverse Decades of Instinct. Bloomberg, May 26.
Glassman, James K., and Kevin A. Hassett. 1999. Dow 36,000. 1st ed. New York: Times Business.
Hegel, Georg Wilhelm Friedrich. 1807. [1971]. The Phenomenology of Mind. Translated with an introduction and notes by J. B. Baillie. 2nd Revised ed. London and New York: George Allen & Unwin and Humanities Press.
Hussman, John 2000. Hussman Investment Research and Insight 1 (2, October 3).
Hussman, John 2015a. The "New Era" is an Old Story (and Introducing Market Cap/GVA). Hussman Funds Weekly Market Comment, May 18.
Hussman, John 2015b. Rarefied Air: Valuations and Subsequent Market Returns. Hussman Funds Weekly Market Comment, November 30.
Hussman, John 2016. Far Beyond Double. Hussman Funds Weekly Market Comment, October 31.
Kliman, Andrew, Shimshon Bichler, and Jonathan Nitzan. 2011. Systemic Crisis, Systemic Fear: An Exchange. Special Issue on 'Crisis'. Journal of Critical Globalization Studies (4, April): 61-118.
London, Jack. 1907. [1957]. The Iron Heel. New York: Hill and Wang.
McKinsey & Company, Richard Dobbs, Anu Madgavkar, James Manyika, Jonathan Woetzel, Jacques Bughin, Eric Labaye, Liebeth Huisman, and Pranav Kashyap. 2016. Poorer Than Their Parents? Flat or Falling Incomes in Advanced Economies. McKinsey Global Institute (July): 1-99.
Nitzan, Jonathan. 1989. Price and Quantity Measurements: Theoretical Biases in Empirical Procedures. Working Paper 14/1989, Department of Economics, McGill University, Montreal, pp. 1-24.
Nitzan, Jonathan. 1992. Inflation as Restructuring. A Theoretical and Empirical Account of the U.S. Experience. Unpublished PhD Dissertation, Department of Economics, McGill University.
Nitzan, Jonathan, and Shimshon Bichler. 2009a. Capital as Power. A Study of Order and Creorder. RIPE Series in Global Political Economy. New York and London: Routledge.
Nitzan, Jonathan, and Shimshon Bichler. 2009b. Contours of Crisis III: Systemic Fear and Forward-Looking Finance. Dollars & Sense, June 12.
Nitzan, Jonathan, and Shimshon Bichler. 2014. Can Capitalists Afford Recovery? Three Views on Economic Policy in Times of Crisis. Review of Capital as Power 1 (1): 110-155.
Ostry, Jonathan D., Parkash Loungani, and Davide Furceri. 2016. Neoliberalism: Oversold? Finance and Development (June): 38-41.
Shiller, Robert J. 2000. Irrational Exuberance. Princeton, NJ: Princeton University Press.
Veblen, Thorstein. 1904. [1975]. The Theory of Business Enterprise. Clifton, New Jersey: Augustus M. Kelley, Reprints of Economics Classics.