Research Note
Can Capitalists Afford Recovery? A 2018 Update and a Closer Look
Shimshon Bichler and Jonathan Nitzan
Jerusalem and Montreal, October-November, 2018
![]() bnarchives.net / Creative
Commons (CC BY-NC-ND 4.0)
bnarchives.net / Creative
Commons (CC BY-NC-ND 4.0)
Posted on October 26, 2018
In our work, we’ve argued that, contrary to the conventional creed, capitalists dislike recovery. Their main driving force, we’ve claimed, is not the absolute level of their income, but its distributive share, and this later emphasis has far-reaching implication. Whereas the absolute level of capitalist income correlates with the absolute level of economic activity, the distributive share of that income depends on capitalist power. And in the United States – and this is the key point here – the power of capitalists relative to the underlying population depends crucially on the sabotage inflicted by unemployment. Since unemployment is inversely related to growth, it follows that capitalists cannot really afford recovery, particularly a prolonged one.
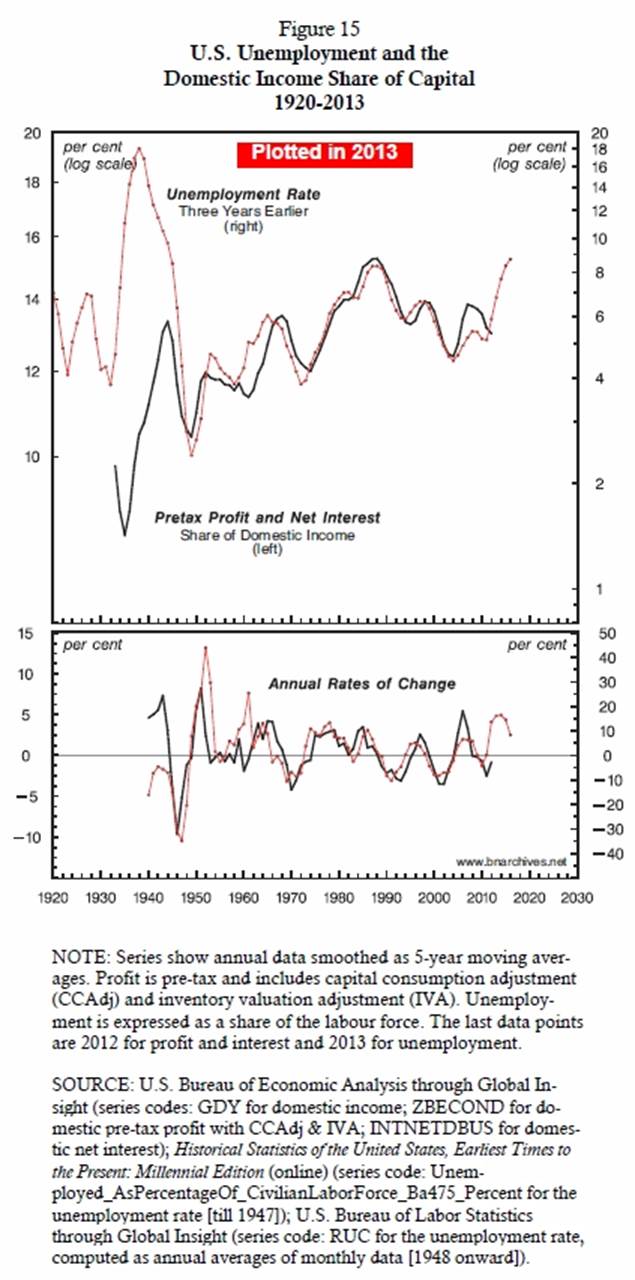
This claim is illustrated by the first figure, taken from our paper ‘Can Capitalists Afford Recovery’ (Bichler and Nitzan 2013; Nitzan and Bichler 2014a). The chart shows the overall share of capital in domestic income along with the rate of unemployment. The top panel displays the levels of the two variables, both smoothed as 5-year moving averages. The solid line, plotted against the left log scale, shows pretax profit and net interest as a percent of domestic income. The dotted line, plotted against the right log scale, shows the rate of unemployment three years earlier. The bottom panel shows the annual rates of change of the two top variables since 1940.
A Leading Indicator
The data show unemployment to be a highly reliable leading indicator for the capitalist share of domestic income, for both levels and rates of change. In general, the higher the level (or rate of change) of unemployment, the greater the share of capital in domestic income (or its rate of change), and vice versa.
Based on this long-term relationship, we wrote in 2014 that, ‘Looking forward, capitalists have reason to remain crisis-happy: with the rate of unemployment again approaching post-war highs, their income share has more room to rise in the years ahead’ (Nitzan and Bichler 2014b).
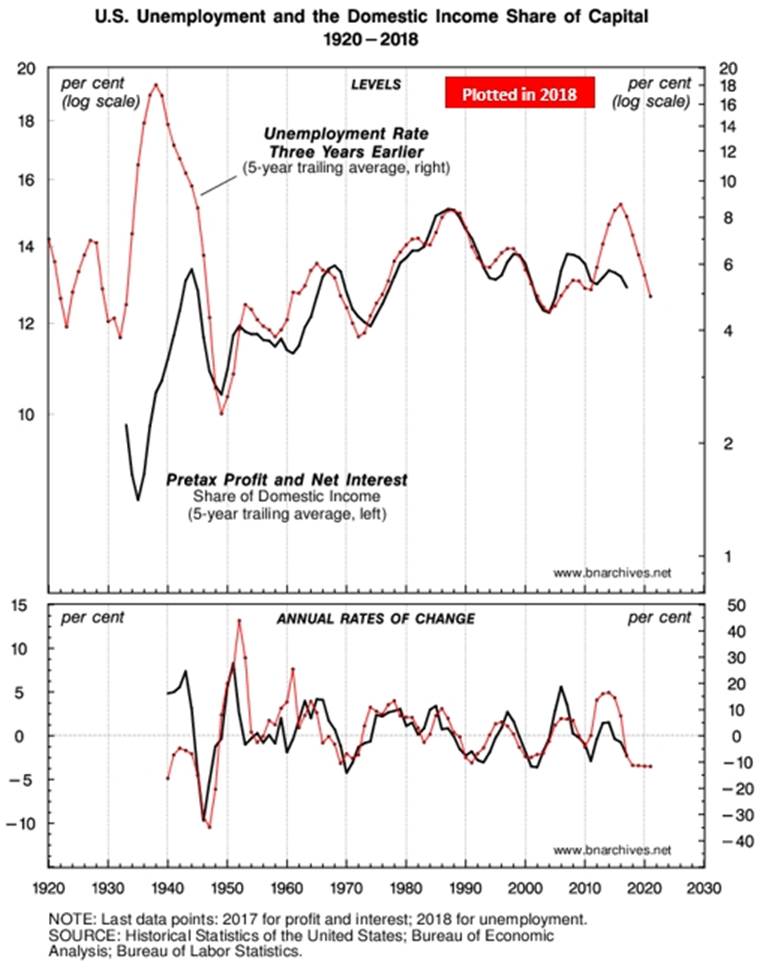
And that is indeed what happened. According to the second, the up-to-date figure, in 2013, the share of capital in domestic income started to rise (top panel) while its growth rate accelerated (bottom panel). But the ascent didn’t last long. Unemployment had peaked, and as it started its prolonged decline, the capitalist income share as well as its rate of change headed south.
The Coming CasP Crisis
Looking forward, the prognosis for capitalists seems negative. Over the last few years, unemployment has fallen sharply, and if the predictive power of our chart remains intact, the capitalist income-share-read-power is bound to contract further, raising the ante for a prolonged accumulation crisis. Eventually, though, capitalists are likely the resolve their CasP crisis, as they have done repeatedly for nearly a century, by offloading it onto the underlying population in the form of rising unemployment.
References
Bichler, Shimshon, and Jonathan Nitzan. 2013. Can Capitalists Afford Recovery? Economic Policy When Capital is Power. Working Papers on Capital as Power (2013/01, October): 1-36.
Nitzan, Jonathan, and Shimshon Bichler. 2014a. Can Capitalists Afford Recovery? Three Views on Economic Policy in Times of Crisis. Review of Capital as Power 1 (1): 110-155.
Nitzan, Jonathan, and Shimshon Bichler. 2014b. Profit from Crisis: Why Capitalists Do Not Want Recovery, and What That Means for America. Real-World Economics Review Blog, April 30.
A Closer Look (a follow-up post, November 2, 2018)
Our RWER blog post, ‘Can capitalists afford recovery: A 2018 update’, showed U.S. unemployment to be a highly reliable leading indicator for the capitalist share of domestic income three years later.
An observant commentator, though, suggested otherwise (first comment by jayarava). Although true for much of the postwar period, this association no longer holds, s/he argued. ‘Something changed after the global financial crisis to decouple unemployment from income shares’, s/he posited, pointing to the ‘new power of globalized capital to force down wages even in times of [low] unemployment’ (or rather, that during an expansion, capitalists can raise prices faster than wages, thereby augmenting their income share, which is the conventional view; Profit from Crisis, 2014: 130).
This post assesses this claim more closely, by examining the correlation between (1) absolute levels of unemployment and the capitalist share of income, and (2) their respective rates of change.
Absolute Levels
Figure A1 deals with absolute levels. The top panel shows pretax profit and net interest as a share of domestic income on the left log scale and the rate of unemployment three years earlier on the right log scale (original series are smoothed as 5-year trailing averages). The bottom panel shows two measures of correlation between these two series. The first is a 10-year trailing correlation, where each observation shows the Pearson correlation coefficient over the past ten years. The second is a 30-year trailing correlation, with each observation denoting the correlation over the past 30 years.
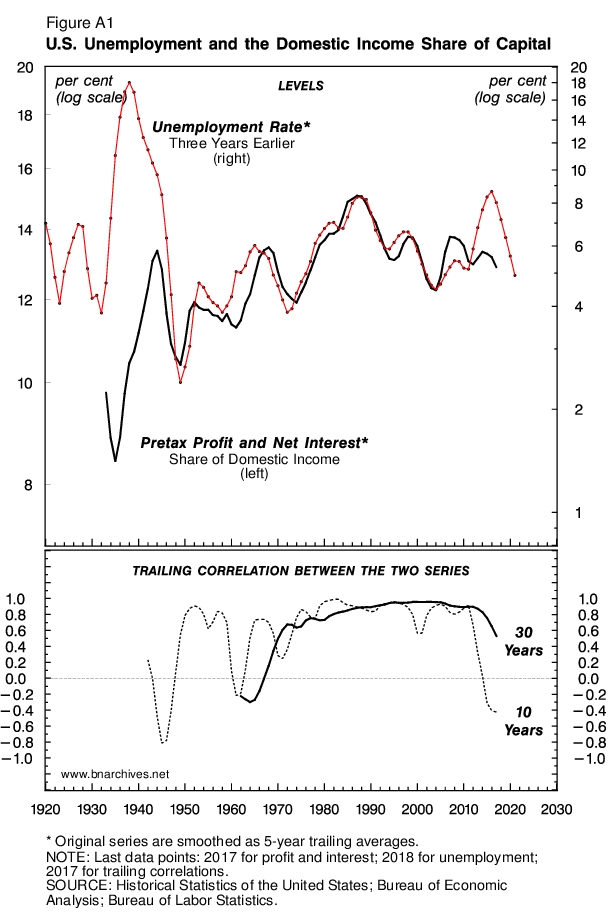
Until the 1960s, both correlations were unstable and occasionally negative. Unemployment certainly sabotaged the underlying population, but its effect on the capitalist share of domestic income was hardly systematic and therefore unreliable as a redistributional lever. From the 1960s onward, though, the relationship began to stabilize, and by the 1970s unemployment became an almost perfect predictor of the capitalist share of domestic income three years later. All in all, until the early 2010s, both the 10- and 30-year trailing correlations hovered around 0.9, with very minor deviations.
But then, as the commentator correctly observed, in the early 2010s things seem to have changed, with both measures dropping and the 10-year correlation becoming negative in the second half of the decade.
Whether this drop represents a meaningful ‘structural change’ remains to be seen (note that a similar drop in the correlations during the early 1960s proved temporary). Moreover, absolute levels are just one aspect of the nexus between unemployment and the capitalist share of income. The other is rates of change, and here the pattern seems unchanged.
Rates of Change
The top panel of Figure A2 plots the annual growth rates of unemployment and the capitalist share of income, while the bottom panel measures their 10-year and 30-year trailing correlations.
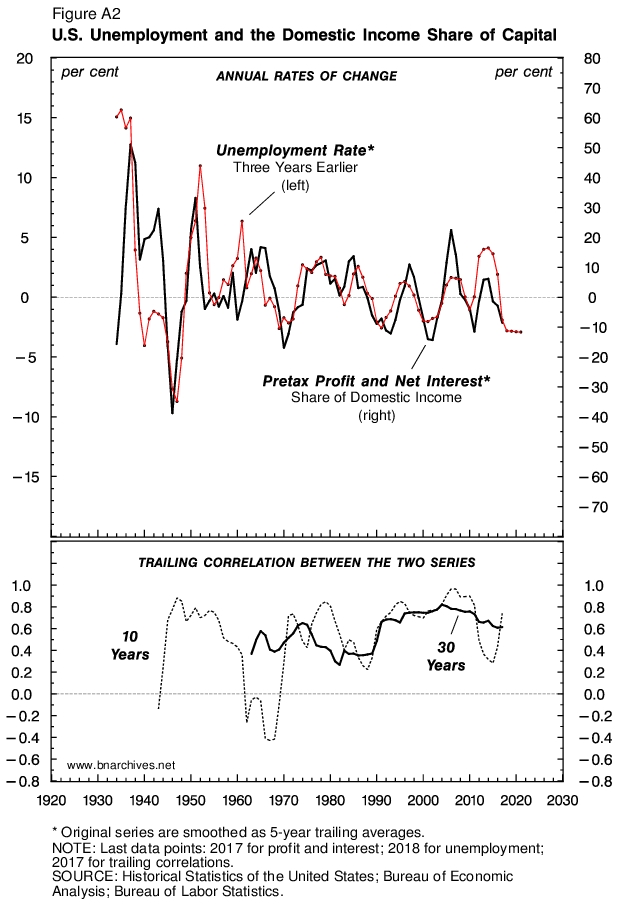
The overall temporal picture here is not very different from the one presented in Figure A1: the correlations between the rates of change were relatively unstable and occasionally negative till the 1960s and positive and relatively stable thereafter. The main difference concerns the decade of the 2010s. Whereas in Figure A1, the 10-year absolute levels correlation drops to negative territory, in Figure A2 the rates of change correlations – at both at the 10- and 30-year range – remain positive. As of 2017, the 30-year correlation was 0.6, while the 10-year correlation was nearly 0.8.
Judging by this figure, the efficacy of capitalist sabotage in the United States remains intact. Capitalists continue to use crisis and rising unemployment as a means of boosting their income-share-read power. In this context, the post-2009 recovery and falling unemployment are now undermining their income share, and that is something they can hardly afford, certainly not indefinitely. From this viewpoint, the end of the current recovery is a capital-as-power certainty.