Making America great again
Shimshon Bichler and Jonathan Nitzan [1]
Real-World Economics Review, No. 90, December 9, 2019, pp. 2-12
http://www.paecon.net/PAEReview/issue90/BichlerNitzan90.pdf
bnarchives.net / Creative Commons (CC BY-NC-ND 4.0)
1. “Leaders” and “Policymakers”
Trump has promised to Make America Great Again. As a self-proclaimed expert on everything of import – highlighted in this video clip (Anonymous, 2017) – he knows exactly how to increase domestic investment and consumption, boost exports, reduce the country’s trade deficit, expand employment and bolster wages. And as America’s leader-and-policymaker-in-chief, he has taken the necessary steps to achieve every one of these goals. He has lowered taxes on corporations and the rich to induce greater investment, relaxed environmental standards and de-socialized medical care to cut red tape and eliminate waste, curtailed civilian government spending and raised military expenditures to make government lean and mean, warned corporations and individuals to remain economically patriotic and undermined the Fed’s “independence” to prevent interest rates from rising and the stock market from tanking. And if that wasn’t enough, he has also launched a so-called trade war to prevent America from being ripped off by other countries, especially China.
Capitalists and pundits follow him like imprinted ducks. His tweets rattle markets, his announcements are dissected by academics and his utterances are analysed to exhaustion by various media. A visiting alien might infer that he actually runs the world.
And the alien wouldn’t be alone. The earthly population too, conditioned by ivory-tower academics and popular opinion makers, tends to think of political figureheads as “leaders” and “policymakers”. Situated at the “commanding heights” of their respective nation states and international organizations, these “leaders” supposedly set the rules, make policies, steer their societies and determine the course of history. Or at least that’s the common belief.
The reality, though, is quite different. The relentless spread of the capitalist mode of power has long robbed formal politics of its past glory. Contrary to the conventional creed, political figureheads nowadays have little leverage and almost no autonomy. They have become predicable subjects, glorified media pawns whose bureaucratic position subjugates them to a systemic logic they rarely understand but duly obey. Even erratic, “self-made-know-it-all” characters like Trump cannot veer too far from the capitalized script – lest they be reprimanded or simply purged in a capitalist backlash.
Note that our point here is not that formal politics cannot change the world, but that it cannot do so without significantly transforming the capitalist mode of power in which it is embedded. And such a transformation is something that most present-day politicians cannot even contemplate, let alone achieve.
2. Differential profit
Begin with profit. According to former U.S. President Calvin Coolidge, “the chief business of the American people is business”. His proposition, made in 1925, has since become the ideology and praxis of nearly all nation states on earth. And given that business is ultimately about profit, the “greatness” of a country must be judged by its differential profit – in this case, the profit its capitalists earn relative to those earned by capitalists in other countries.
Figure 1 offers a historical overview of this differential, showing the global distribution of net (after tax) corporate profit between firms listed in (1) the United States, (2) developed markets excluding the United States and (3) the rest of the world.
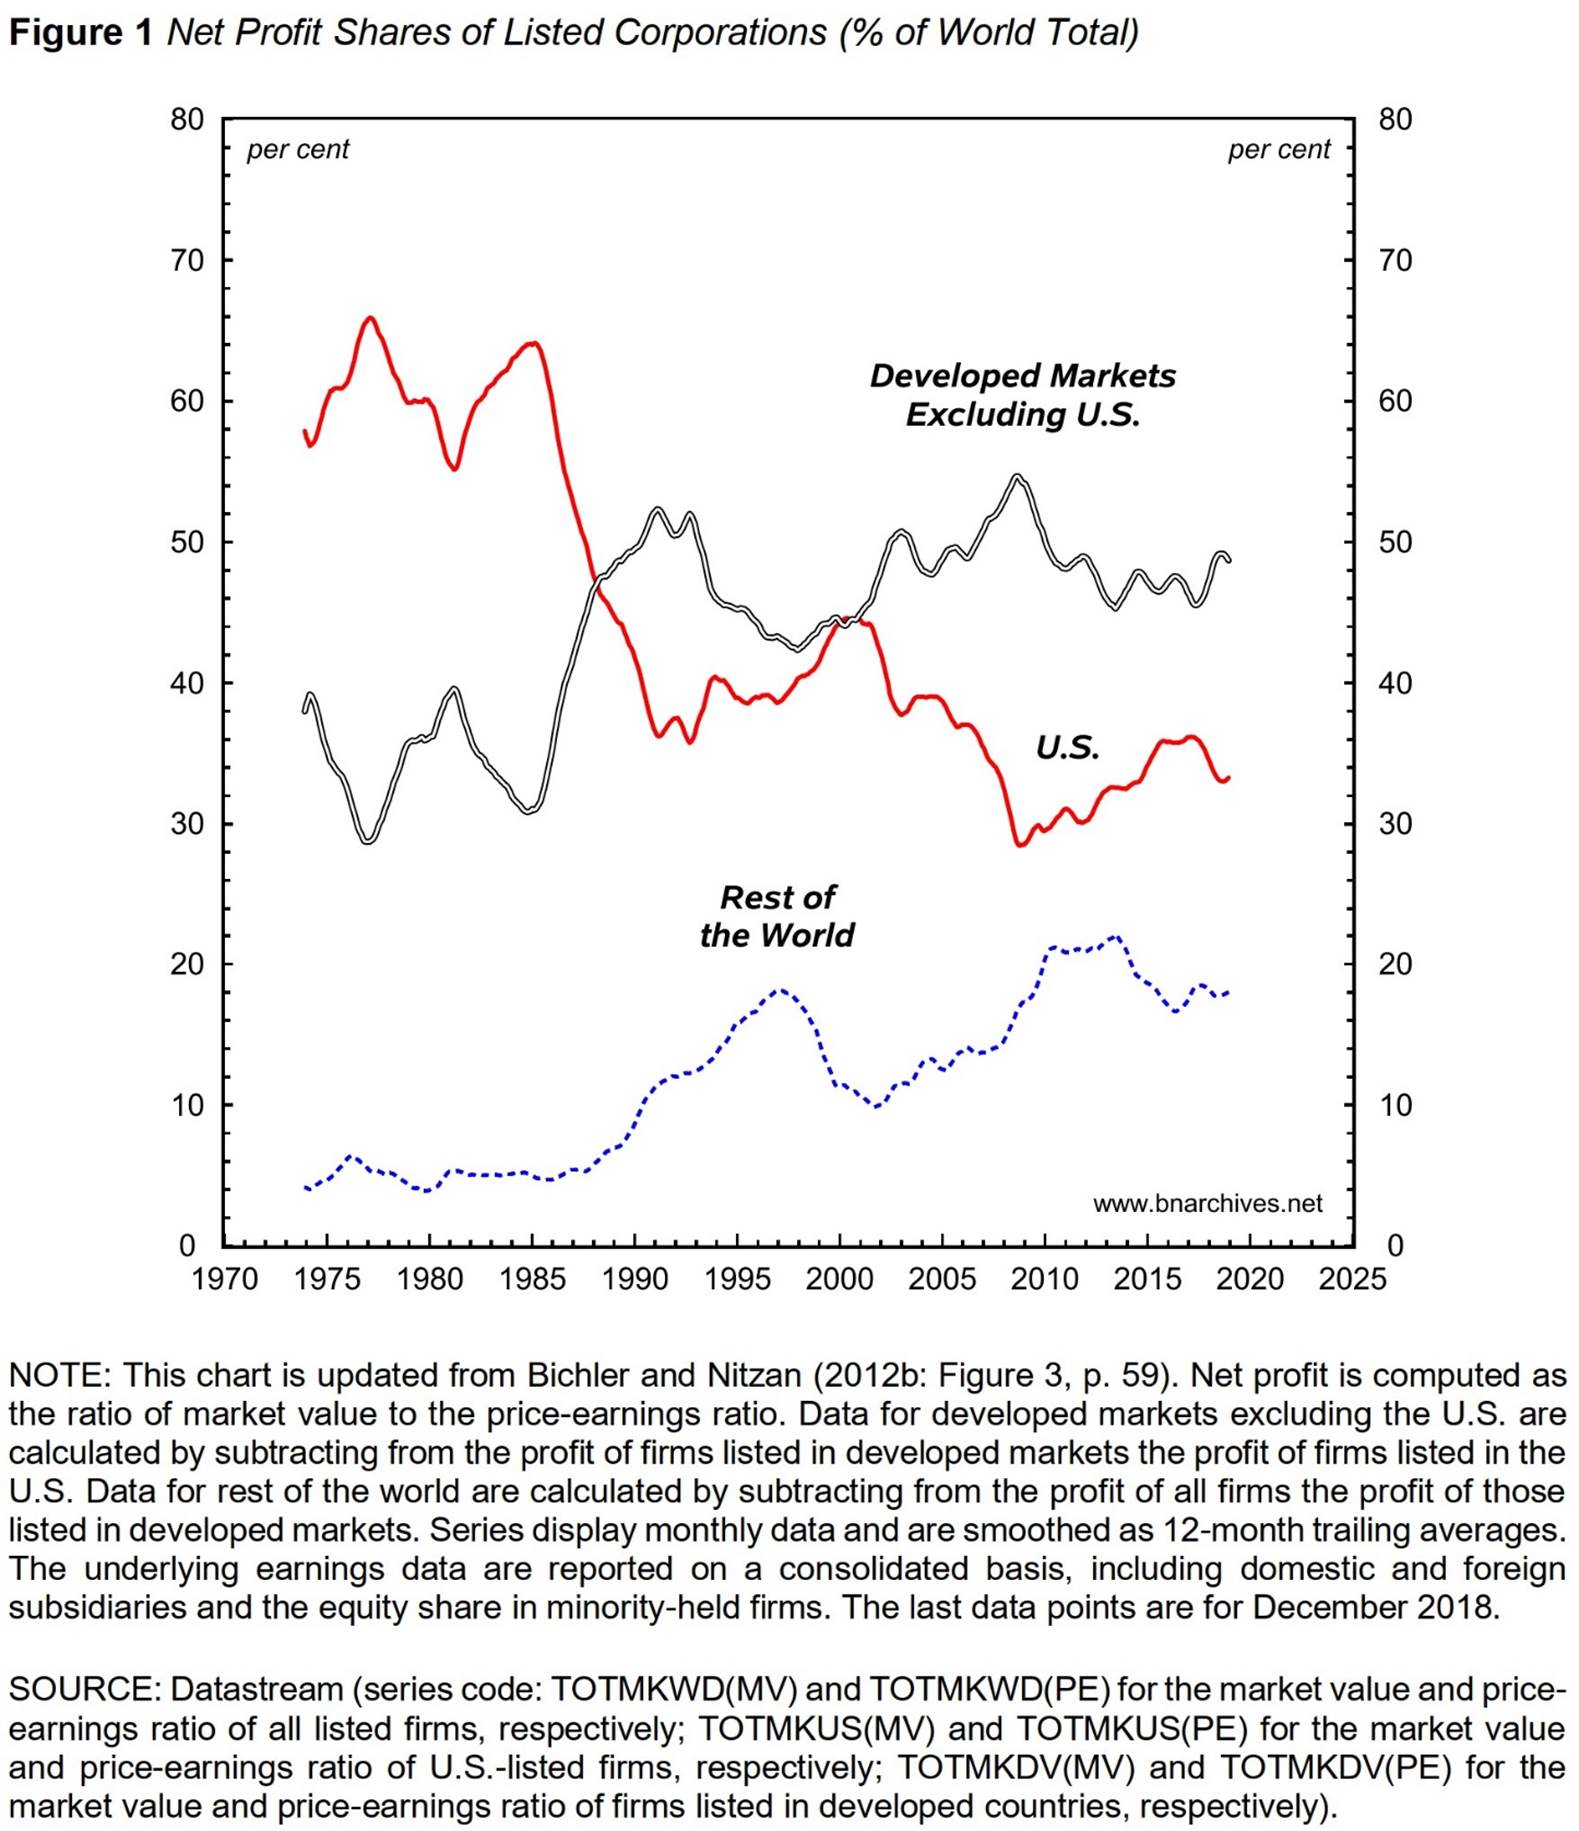
During the 1970s and early 1980s, U.S. corporate owners still reigned supreme, earning over 60 per cent of all net profit recorded by listed firms around the world. But with the ascent of other developed markets in the late 1980s and the rise of emerging markets since the early 1990s, U.S. differential earnings dropped sharply, falling to 30 to 35 per cent of the total in recent years (as a side note, notice the embarrassing 2016-18 downtick during the Trump presidency).
Judging by this chart, and assuming that a country’s “greatness” indeed equals its differential business success, it’s clear that America is no longer great – or at least not as great as it once was.
3. Measuring profit: a closer look
But then, profit is a tricky concept with slippery measurements. As noted, the data shown in Figure 1 pertain to the profit of listed (publicly traded) companies only. They do not cover the profit of unlisted (private) firms. We focus on listed firms here for two reasons. First, there is the issue of size: listed firms tend to represent the largest, “dominant capital” corporations at the centre of the political economy and therefore merit the most attention. Second, there is the question of availability: the profit of listed firms – in this case, those published by Datastream – are available on a regular, standardized basis for most countries, whereas the profit of all firms (listed and unlisted) – which are the purveyance of the national income and product accounts (NIPA) – often are temporally incomplete, incomparable across countries or unavailable altogether.
But do listed firms tell a reliable story?
The answer depends on the story we want to tell. In this paper we take a “populist” view, asking whether Trump can make “America” great again. In other words, our story is intentionally – and anachronistically – nationalistic. And given this populist bent, it is useful to examine the extent to which our listed-firm measures of profit reflect the broader flow of so-called “national” profit. [2]
Figure 2 contrasts the evolution of net profit of U.S.-listed corporations as reported by Datastream with the net profit of all U.S. firms, listed and unlisted, as reported by NIPA. The top two series in the chart show these two flows in current dollars (left log scale). The bottom series expresses the decimal ratio between the Datastream and NIPA numbers (right scale).
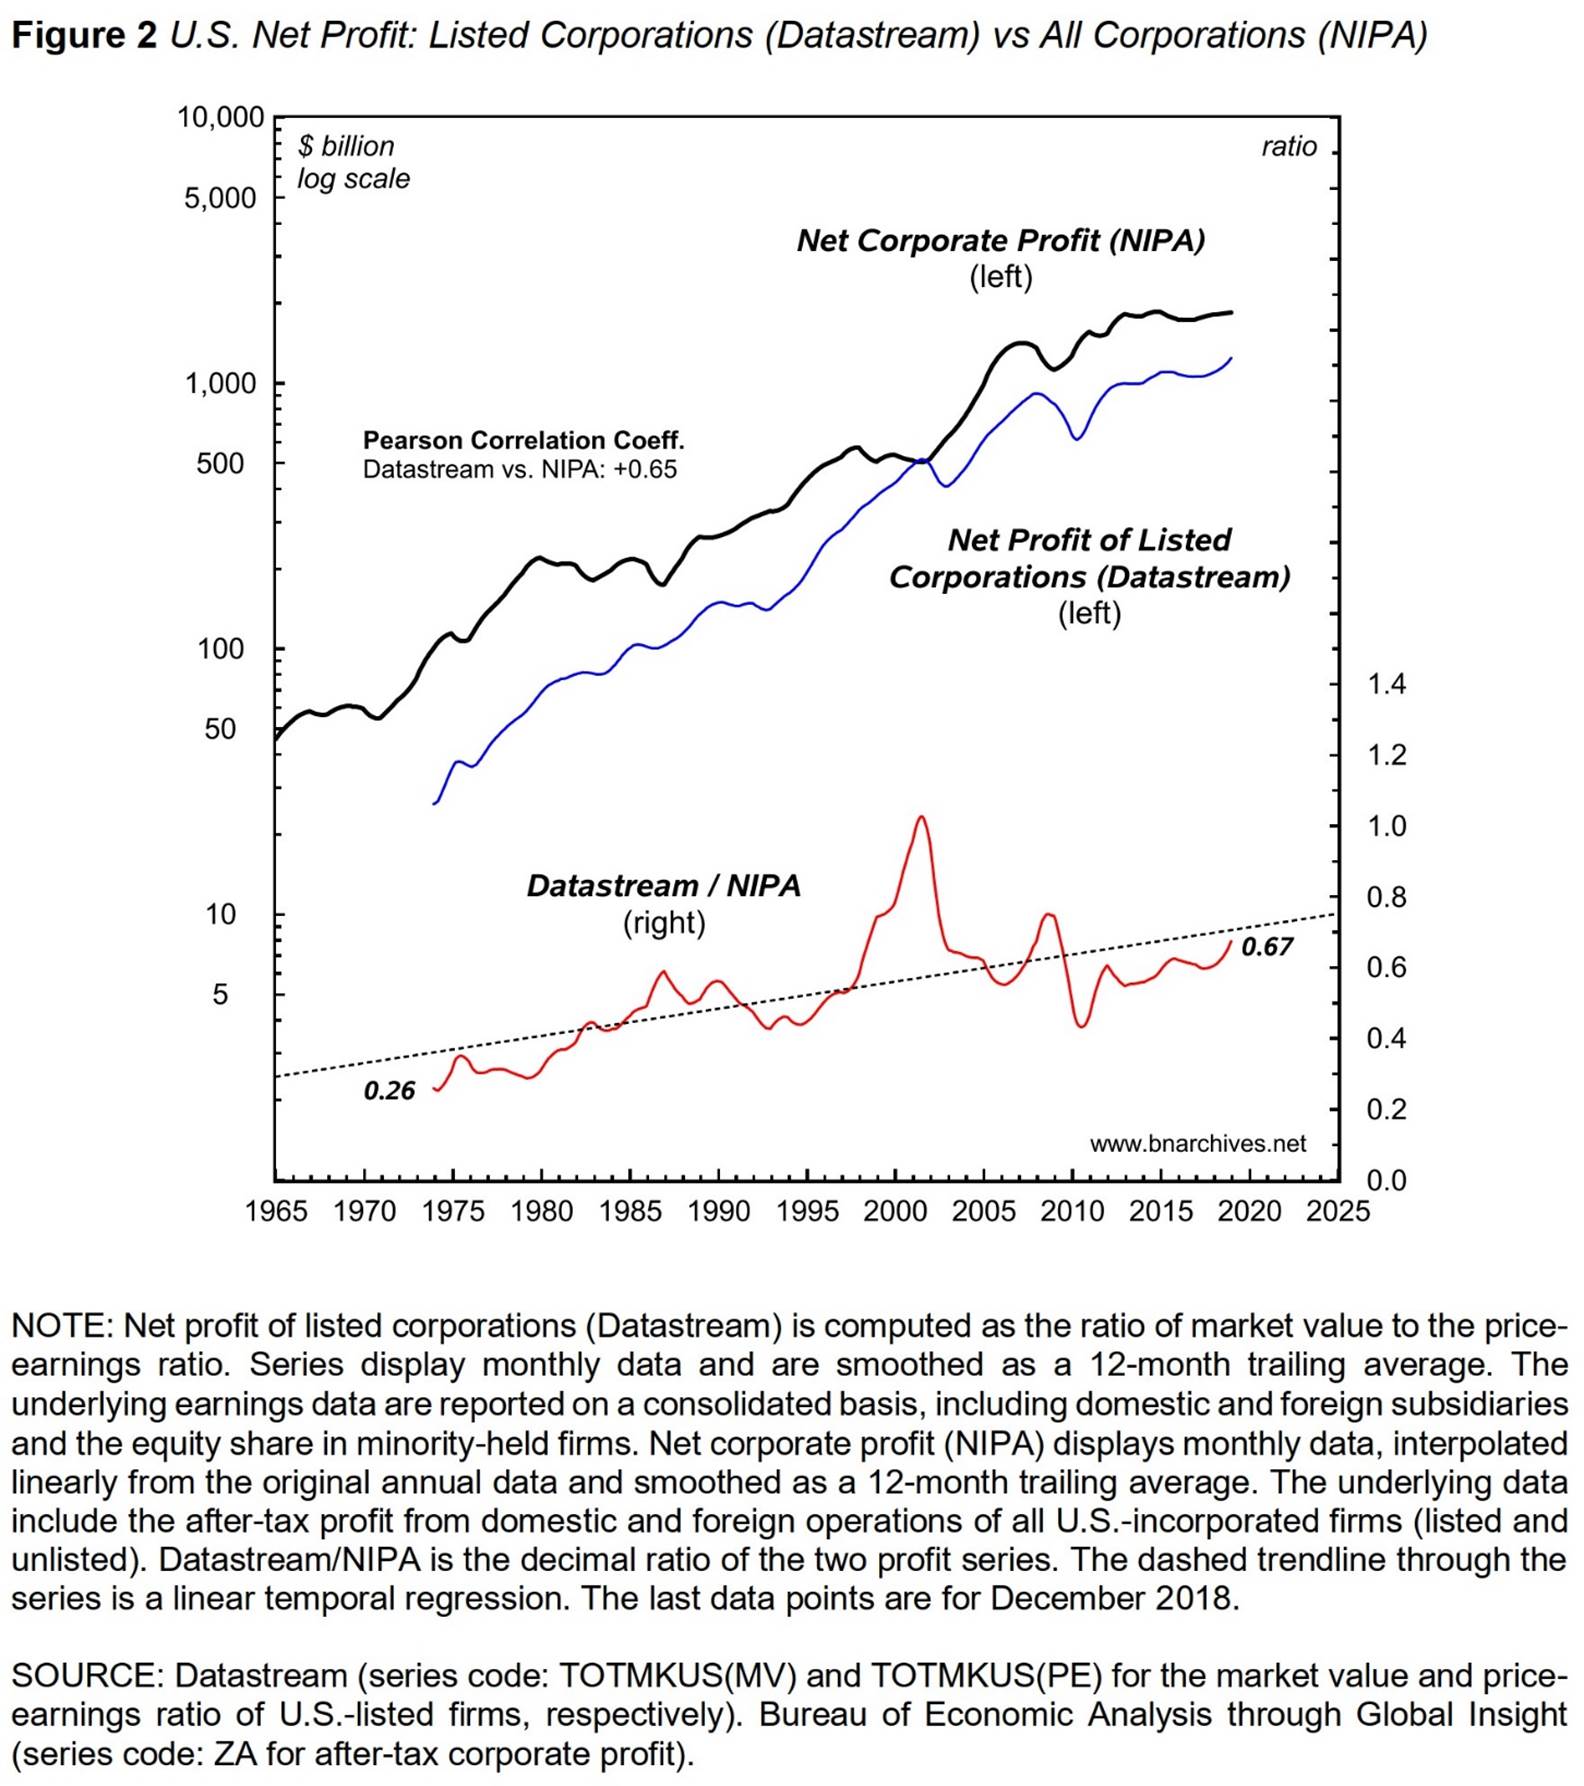
On the face of it, the comparison suggests that, in the United States, the profit of listed firms does offer a good proxy for the profit of all firms. First, the two series are positively correlated (with a Pearson coefficient of +0.65). And second, over time, the profit of listed firms gets closer and closer to that of all firms (with the Datastream/NIPA ratio rising almost threefold, from 0.26 in 1973 to 0.67 in 2018). [3]
4. A simple decomposition
Note that the Datastream universe of companies is not a simple subset of the NIPA universe: whereas NIPA reports the profit of domestically incorporated firms only, Datastream includes the profit of domestically as well as foreign-incorporated firms (provided the latter are listed in one of the country’s stock exchanges). In other words, Datastream and NIPA firms are not nested, but partly overlapping sets.
Equations 1 and 2 decompose Datastream and NIPA profit based on the types of firms covered by each (domestic firms are incorporated locally, while foreign firms are those incorporated in another country):
1.
![]()
2.
![]()
Based on these definitions, the Datastream/NIPA profit ratio is given by:
3.
![]()
Applied to the U.S. case, Equation 3 suggests that the historical uptrend of the Datastream/NIPA profit ratio shown in Figure 2 is the result of either (1) a long-term drop in the NIPA share of profit earned by unlisted domestic firms and/or (2) a long-term rise in the earnings of foreign firms listed in the United States relative to NIPA profit. The next two sections examine these possibilities in turn and assess their implications for the global “decline of the United States” suggested in Figure 1.
5. Going private, going public
During the 1980s and 1990s, many analysts felt that the end of listed firms was nigh. Michael Jensen (1989) announced the “eclipse of the public corporation”, arguing that the endemic principal-agent problem of listed firms had become a fetter on capitalist efficiency. The public corporation epitomizing this form of organization, he posited, had “outlived its usefulness”. And on the face of it, his prediction seems prescient: the number of U.S.-listed firms peaked in 1996 and then started to drop perceptibly. By 2012, the country had only 4,102 listed firms – half of the 8,025 it boasted in 1996, and even less than the mere 4,775 it had in 1975 (Doidge, Karolyi, and Stulz 2017: Table 1, p. 467).
But on closer inspection, this decline hasn’t really marked the eclipse of the public corporation. To start with, the key issue here is not the number of listed firms, but their overall importance in the accumulation process. And on that count, the U.S. public corporation remains central. According to Doidge, Karolyi and Stulz (2017), most “delisted” public firms disappear due to mergers and acquisitions, and with the vast majority of their acquirers being public rather than private, the bulk of their profits and assets do not end up in “private” hands, but rather re-list under a new public guise. Moreover, firms that do go private – either for “cause” (because they no longer qualify) or voluntarily – tend to be smaller than those that are taken over or merged, so the aggregate effect of their going private is relatively small.
The net result of these considerations is that, although the number of public firms in the U.S. has nearly halved since the late 1990s, their relative size has declined only marginally if at all. According to our computations, the net profit of the top 0.01 per cent of all U.S.-incorporated firms (which are all listed) rose from 29 per cent of NIPA profit in the 1950s to 69 per cent in 1980s, and then oscillated sideways around an average of 54 per cent for the next two decades (Bichler and Nitzan 2012a). [4] In other words, they are still very significant. Moreover, if we were to include in this computation all listed firms rather than the very top ones, their proportion of NIPA profit would be much higher. All in all, then, U.S. public firms are fewer in number, but having grown much bigger in size they remain very much dominant in the aggregate.
The situation in the rest of the world is far clearer. Following the onset of neoliberalism in the 1980s and the emerging-markets boom of the 1990s, existing stock markets outside the United States started to flourish, new ones were established and non-U.S. firms, including large ones, listed themselves in droves. As a result of these processes, from 1987 to 2012 the number of listed firms outside the United States more than tripled, with most of the listings occurring in the developing world (Doidge, Karolyi, and Stulz 2017: Figure 1, p. 466). Whereas in the United States public firms remain central but perhaps no longer growing in importance, in the rest of the world their journey has only just begun. [5]
The implication of these two movements – inside and outside the United States – can be assessed, however tentatively, in reference to Equation 3. In the United States, the NIPA profit share of unlisted corporations has probably followed a flat U-shape trajectory – falling till the late 1980s and rising thereafter. Outside the United States, the NIPA profit share of unlisted corporations has probably declined, due to the listing of more and more firms as well as an increase in the relative size of listed firms.
Now, if these guesstimates are correct, they mean that our Datastream profit numbers reflect the trajectory of NIPA profit in the United States but overestimate it elsewhere. Put differently, they mean that, ceteris paribus, the decline in the global profit share of listed U.S. firms is greater than the decline in the global profit share of all U.S. firms, listed and unlisted. In short, all else remaining the same, American profit “as a whole” hasn’t declined by as much as Figure 1 would have us believe.
6. Trojan horses
But not everything has remained the same. It turns out that many U.S.-listed corporations are not “American” but “foreign” (assuming this distinction is meaningful to start with), and that fact has important implications for our measurements.
Note that the firms represented in Figure 1 are grouped based on where they are listed rather than where they are incorporated. In most countries, listed firms are almost always domestically incorporated, so this distinction is immaterial. But it certainly matters in global financial centres such as the United States, whose stock markets are home to many “Trojan horses”: locally listed firms that are incorporated elsewhere. And the crucial point for our purpose here is that the proportion of such firms has risen significantly in recent decades.
Based on the U.S. Compustat “funda” file, in 1950 foreign-incorporated firms accounted for only 4 per cent of the country’s top 500 listed corporations. But that number grew rapidly: it rose to 14 per cent of the total in 1980, 26 per cent in 1990, 41 per cent in 2000 and 48 per cent in 2010 (Bichler and Nitzan 2012a, p. 52). Other financial centres such as the United Kingdom and Hong Kong may have seen a similar increase, but because most of their Trojan horses are not U.S.-incorporated, this increase does not affect our U.S./ex-U.S. division here.
As before, the net effect of this process can be assessed in reference to Equation 3. In the United States, exponential growth in the number of listed foreign firms most probably caused their aggregate profit to rise much faster than the country’s NIPA profit. Outside of the United States, this process has had no similar effect. If we are correct in assuming that most foreign firms that list in countries other than the United States are also incorporated in countries other than the United States, then the profits of these foreign firms are counted as part of the NIPA profit of the rest of the world. While foreign to the specific country where they are listed – for example, a Dutch firm listed in London, or an Australian firm listed in Hong Kong – they are not foreign to the ex-U.S. universe as a whole.
Weighing these two processes together, we can say that, as a global phenomenon, the rise of foreign-listed firms means that our estimates in Figure 1 understate the global decline of “purely” U.S. firms. If foreign-listed firms were excluded from our Datastream numbers, the drop in the U.S. share of global profit would have been steeper than what the chart currently shows.
All in all, then, we have two opposite movements: (1) an overestimation of the U.S. decline due to the disproportionate shift outside the United States from private (unlisted) to public (listed) firms; and (2) an underestimation of the U.S. decline due to the rise, in the U.S. and other financial centres, of foreign-listed firms.
Without further research, it is hard to weigh the exact balance of these two trajectories. But given that the effects of these two trajectories on the profit share of the United States are opposite in direction and therefore cancel each other out to some extent, it seems reasonable to conclude, however tentatively, that their balance might alter the pace of the U.S. decline but not its general direction. In other words, judging by the available profit data, the U.S. indeed seems on a long-term decline.
7. The exchange rate
But couldn’t this fall from business grace, even if true on paper, be mostly a consequence of changing exchange rates (Francis, Bichler, and Nitzan 2009-2010)? Since international profits are denominated in multiple currencies, their relative trajectories could be affected by their absolute levels as well as the rates at which they convert, and it is impossible to say, at least not a priori, which of the two factors is more important and to what extent.
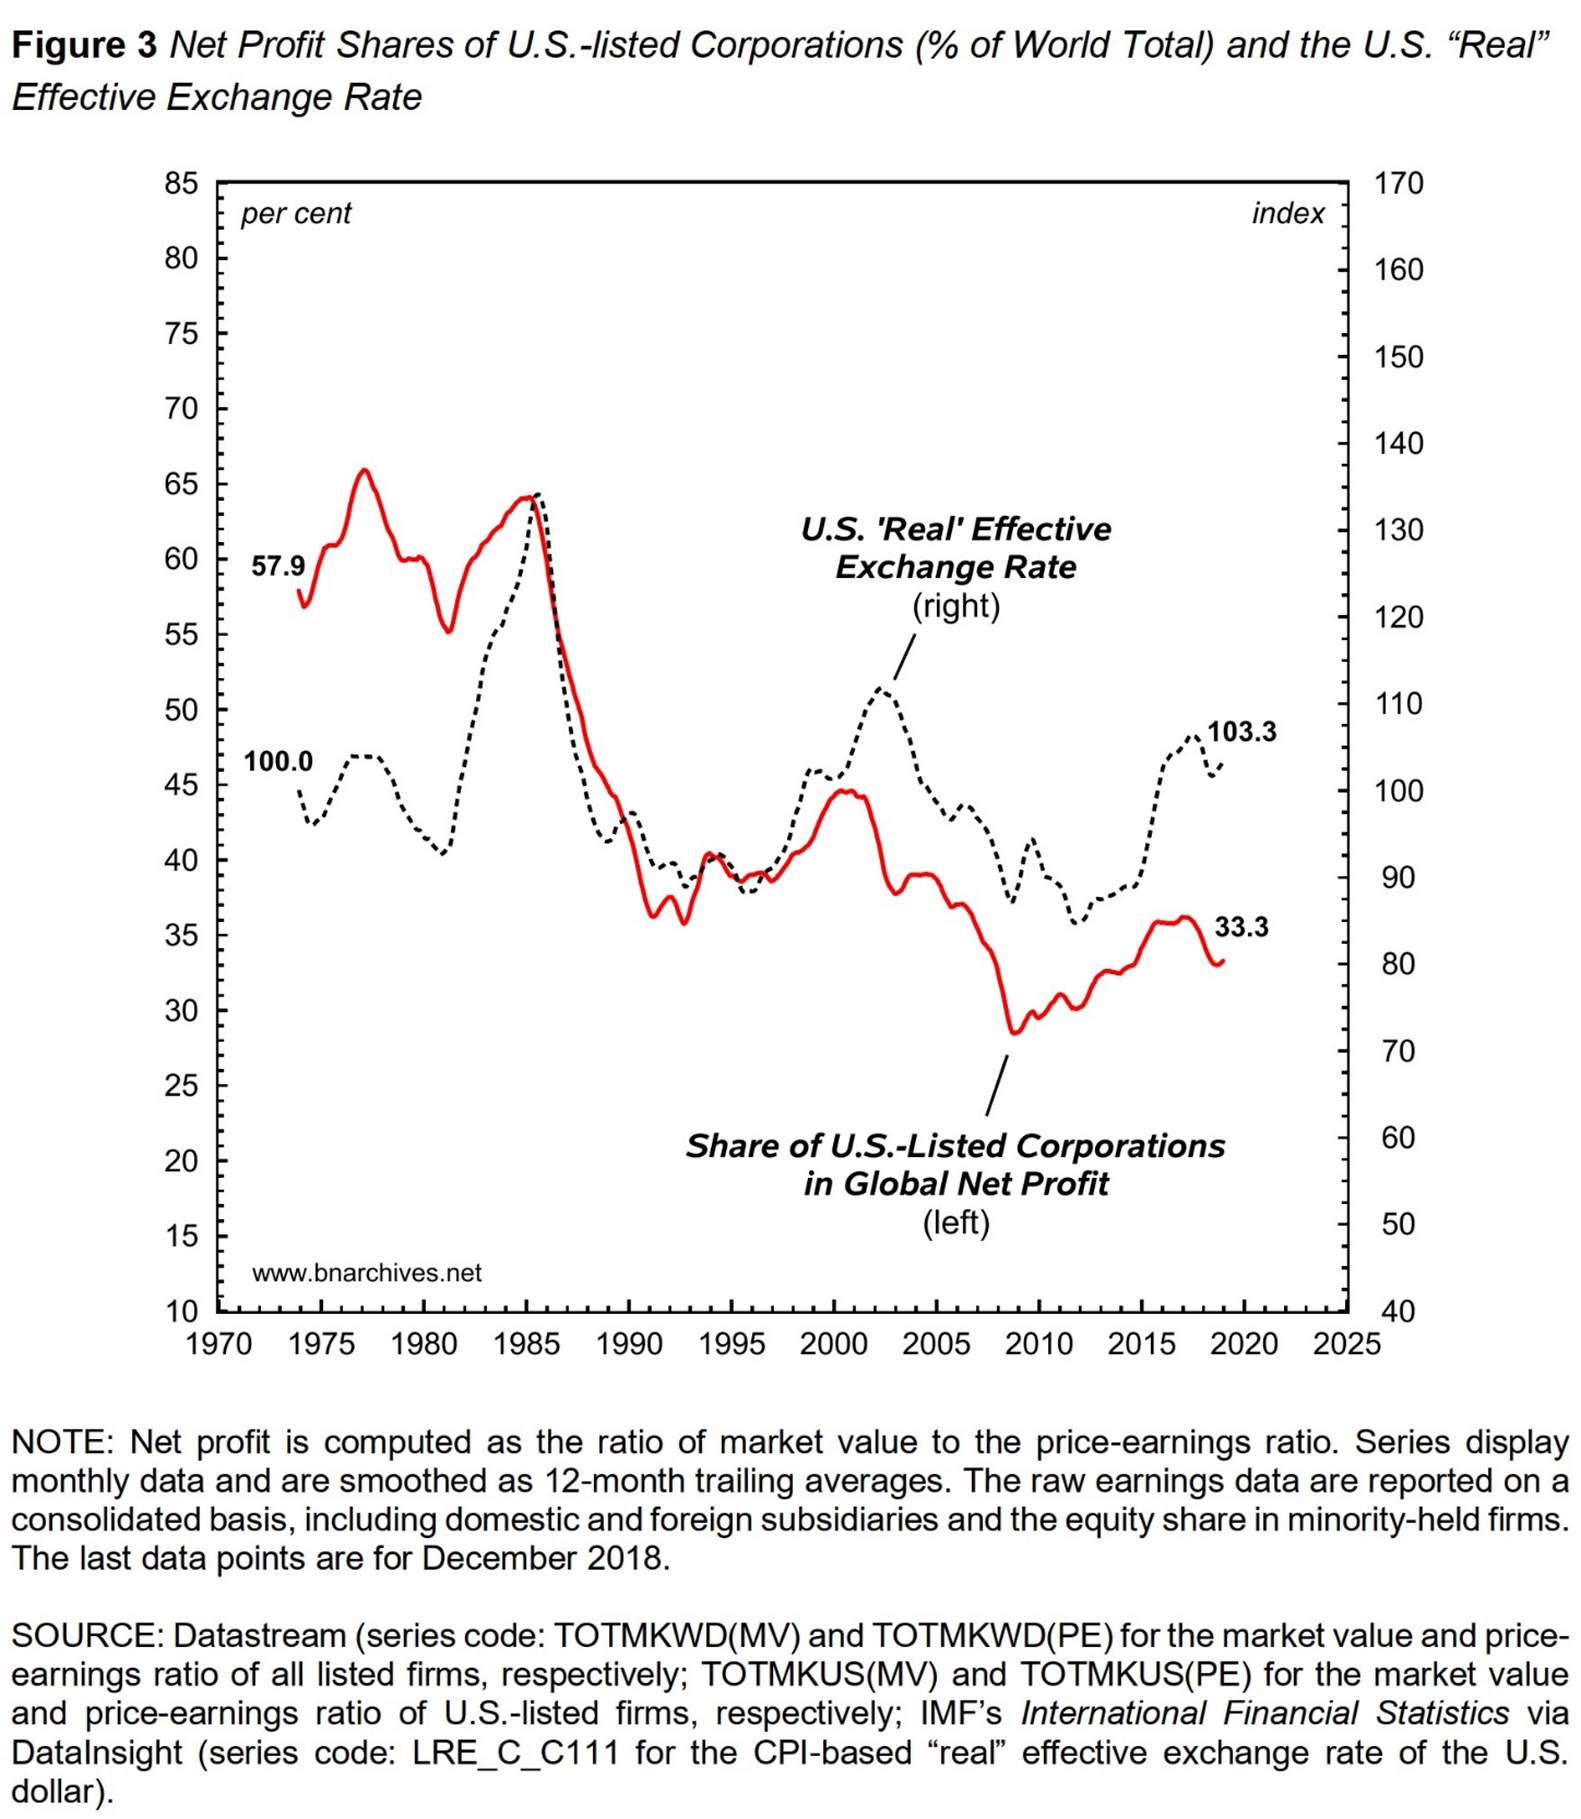
In general, when the U.S.’s “real” effective exchange rate depreciates – in other words, when the dollar’s value falls relative to a basket of traded currencies adjusted for their respective consumer prices – non-U.S. firms charge relatively higher prices than U.S. firms do and/or convert their local-currency earnings to more U.S. dollars, thus causing the U.S. share of global profit to fall – and vice versa when the “real” effective exchange rate appreciates (the “real” effective exchange rate of a country depreciates/appreciates with a fall/rise in its nominal exchange rate, as well as when domestic prices decline/increase relative to foreign ones).
Figure 3 shows this impact by contrasting the global profit share of U.S.-listed firms on the left-hand scale with their country’s “real” effective exchange rate on the right, and according to the chart the two series indeed correlate positively. But the correlation is entirely cyclical. The long-term trends are not correlated at all: during the past half-century, the exchange rate moved sideways (starting at 100 in 1973 and ending at 103 in 2018), while the global profit share dropped perceptibly (beginning at 57.9 per cent in 1973 and ending at 33.3 per cent in 2018). In other words, America’s fall from business grace can hardly be blamed on its currency.
8. Breaking the national envelope
On the whole, then, the global decline of so-called American firms is not an accounting gimmick or an exchange-rate artefact. It is a real process with real causes and real consequences. And paradoxically, this decline is intimately related to a seemingly opposite process: the growing dependency of these very “American” firms on foreign operations.
This latter dependency is shown in Figure 4. The top series measures the share of U.S. corporate profit coming from foreign subsidiaries, while the bottom series estimates the share earned from exports.
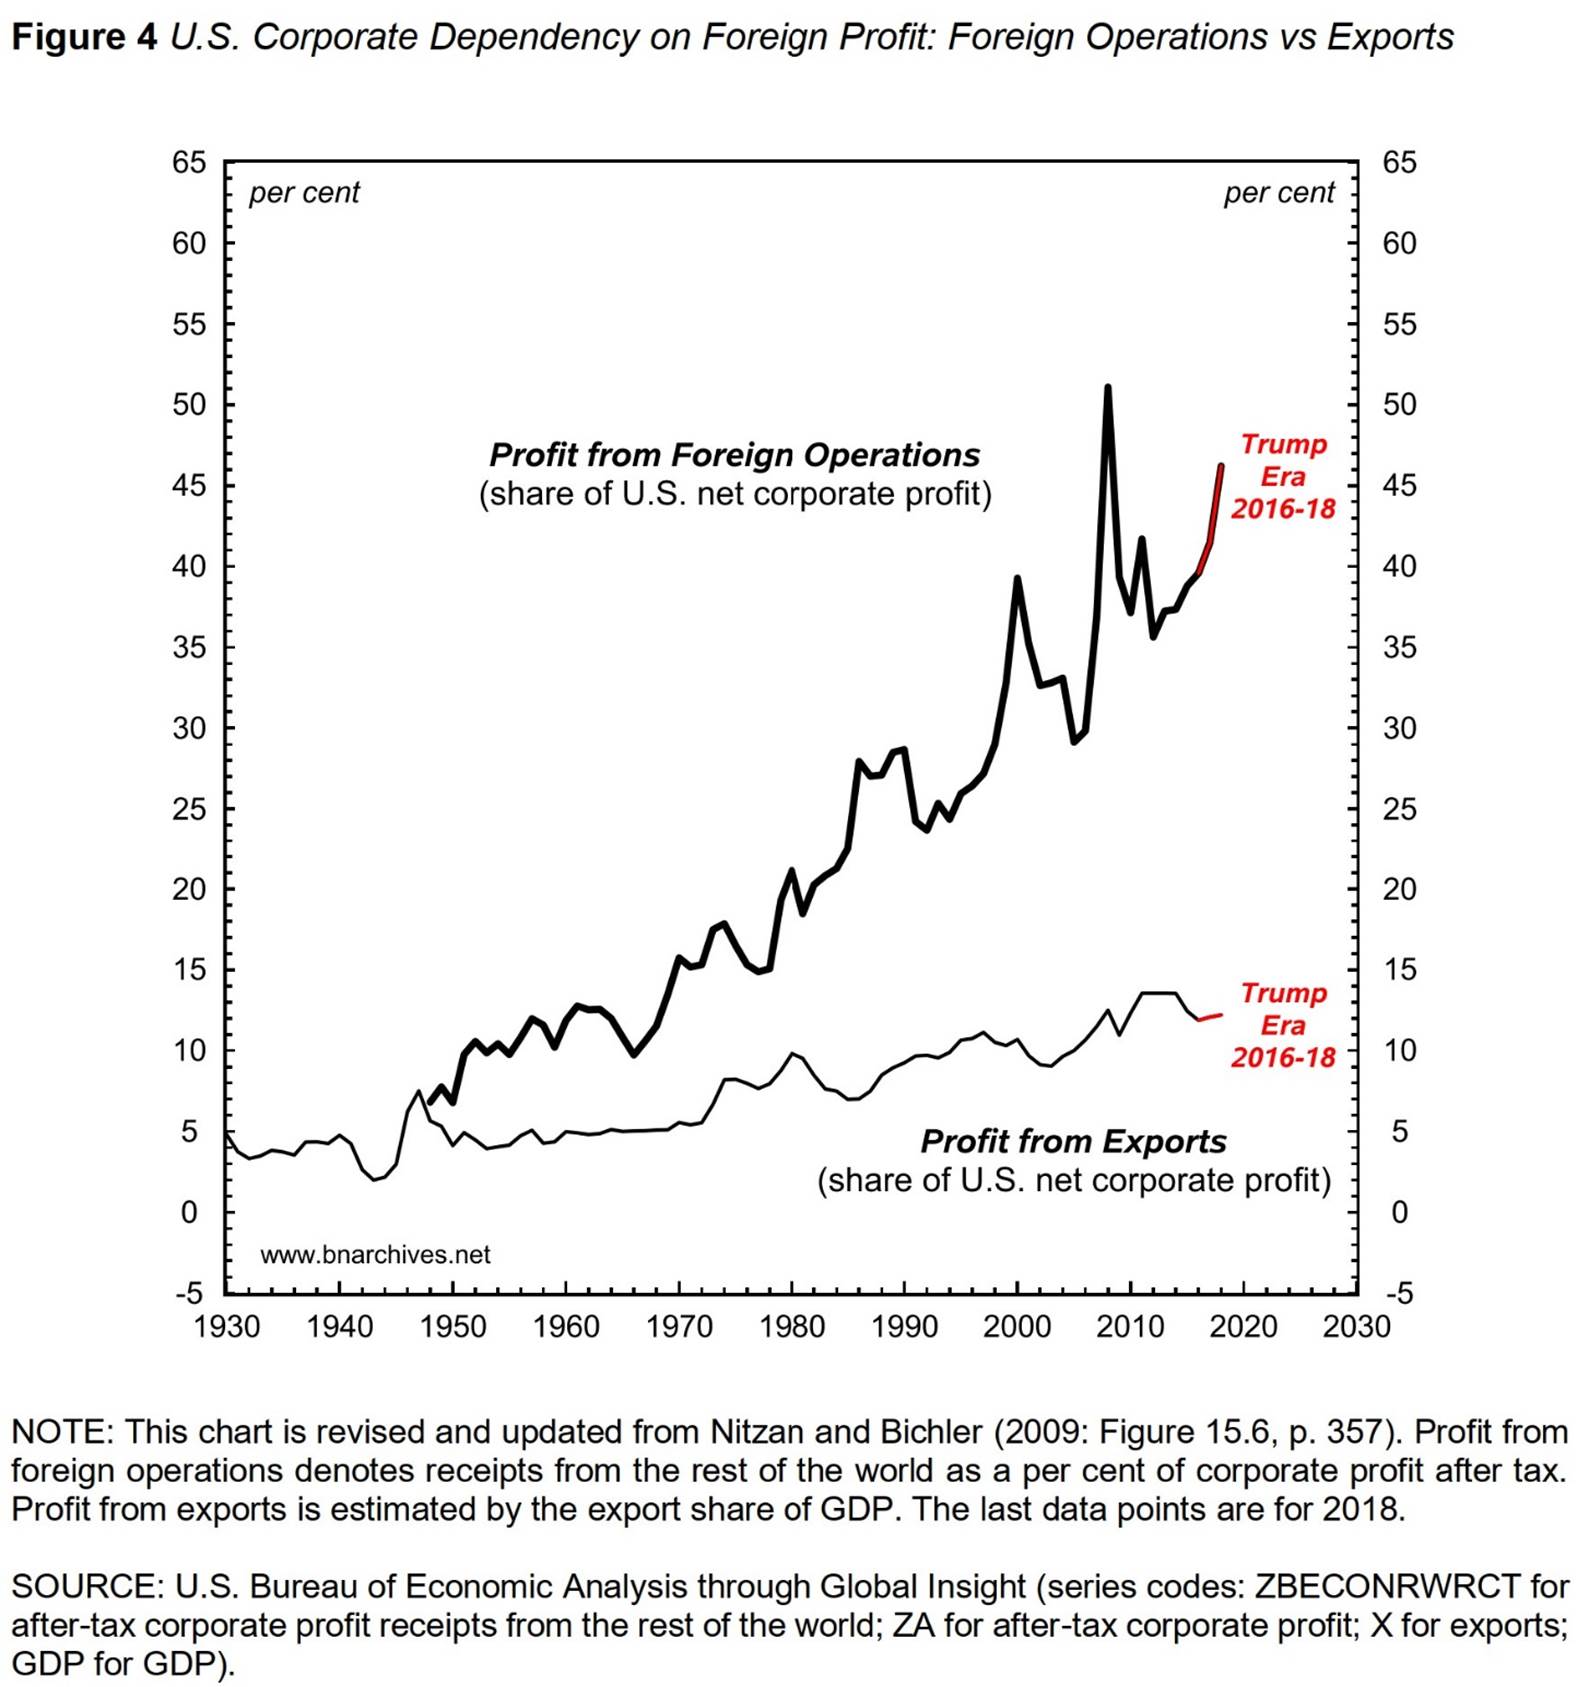
In the mid-1940s, both measures hovered around 7 per cent. The United States was still a relatively closed economy with an expanding population, rising “real” wages and rapidly growing GDP per capita. In this context, U.S. firms looked mostly inward, earning over 85 per cent of their profit from domestic operations.
But the relentless drive of large firms to augment their capitalized power over the underlying population mandated “strategic sabotage” in the form of rising unemployment and slowing growth (as examined in Nitzan and Bichler, 2014; see also the animation by Thouvenot, 2019), while their the quest for differential accumulation relative to lesser firms set in motion a merger and acquisition uptrend that eventually made them “too big” for the decelerating U.S. market (Nitzan, 2001; Nitzan and Bichler, 2009, Part V).
This differential power process, we argue, is key to understanding the exponential rise in the share of foreign corporate profit shown by the top series in Figure 4. Having exhausted the most lucrative takeover targets in their home country, and with their home country stagnating and therefore not generating new takeover targets at a fast enough rate, large U.S. firms have had no choice but to break the national envelope and go global. They started taking over foreign firms at an ever increasing rate (most FDI occurs via mergers and acquisitions rather than greenfield investment), and as the process accelerated the share of foreign profit rose dramatically. Foreign operations currently account for roughly half of all U.S. corporate profit, and if the uptrend persists the so-called American firm will soon become a misnomer.
9. Making America great again
Can Trump reverse or even dent this long-term evisceration of “America”? The short answer is no. So far, his policies have only hastened this evisceration, accelerating the upward redistribution of income and amplifying the de-Americanization of U.S. corporations. During his three years in office, the share of foreign profit, instead of falling, has risen dramatically (final red segment in the top series of Figure 4). Based on his record, it is no wonder that the U.S. “business community”, and particularly its leading firms, are firmly behind him.
The only hair in the soup is his so-called trade war against China (Bichler and Nitzan 2018). On the face of it, this “war” looks like a flash-in-the-pan media stunt. China is unlikely to succumb in any meaningful way – and even if it does, exports are a sideshow for U.S. corporations (bottom series in Figure 4), so the overall impact on the global profit share of U.S. firms is likely to be marginal.
But international trade is not an isolated process. The “free” (read corporate-determined) flow of commodities is the bedrock of “free” (read corporate-determined) foreign investment, and if Trump’s trade war develops into a full-scale investment war, all bets will be off. At that point, and assuming he is still there, the maker of a great-again-America will likely be pressured to reverse course or lose the presidency.
Endnotes
[1] Shimshon Bichler and Jonathan Nitzan teach political economy at colleges and universities in Israel and Canada, respectively. All of their publications are available for free on The Bichler & Nitzan Archives (http://bnarchives.net). An earlier version of this article was posted as a Research Note (Bichler and Nitzan 2019). Research for this paper was partly supported by the SSHRC.
[2] The increasing disconnect between the conventional nationalist/statist categories of political economy and the transnational/global reality of accumulation is examined in Nitzan and Bichler (2006) and illustrated in the remainder of the present article.
[3] Yardeni and Johnson (2019: Figures 26-27, p. 14) show a similarly positive correlation between NIPA and S&P 500 profit, but unlike our Datastream/NIPA ratio, which trends upward, their S&P 500/NIPA ratio oscillates around a horizontal trend (averaging 0.5). One possible reason for this difference is that the number of firms in the S&P 500 is fixed (at 500), while the number of firms in the Datastream universe is rising. For an earlier comparison between S&P 500 and NIPA profit data, see Petrick (2001).
[4] The number of top 0.01 per cent firms increased from 271 in 1950 to 604 in 2010.
[5] These diverging tendencies seem to contradict the popular varieties-of-capitalism wisdom (Hall and Soskice 2001). According to the “varieties” approach, we can distinguish between two modes of corporate governance: the liberal market economies model (LME) were firms tend to rely on the stock market, and the coordinated market economies model (CME) where corporate funds are often raised through credit and fixed-income instruments. The data here, though, seem to suggest convergence. All capitalist countries move toward a growing reliance on market capitalization, only that their starting point and pace of change differ. The developed Anglo-Saxon countries, like the United States and the United Kingdom, were leading the pack and were therefore the first to reach “maturity” with a few thousand firms capitalizing most of the profit. The developed non Anglo-Saxon countries, such as Germany and Japan, started later and are still catching up. And the so-called emerging markets are the laggers who just began to capitalize and still have plenty of grounds to cover before reaching their asymptote. For more on this staggered capitalization process, see Nitzan (1996).
References
Anonymous (2017) “24 Things Nobody Does Better Than Trump (According To Trump).” VICE News, November 13. https://www.youtube.com/watch?v=YA631bMT9g8.
Bichler, Shimshon, and Jonathan Nitzan (2012a) “The Asymptotes of Power.” Real-World Economics Review (60, June), pp. 18-53.
Bichler, Shimshon, and Jonathan Nitzan (2012b) “Imperialism and Financialism: The Story of a Nexus.” Journal of Critical Globalization Studies (5, January), pp. 42-78.
Bichler, Shimshon, and Jonathan Nitzan (2018) “Trump’s Trade Wars Threaten US Foreign Investment.” Real-World Economics Review Blog, March 17.
Bichler, Shimshon, and Jonathan Nitzan (2019) “Making America Great Again.” Research Note, September 24, pp. 1-6.
Francis, Joe, Shimshon Bichler, and Jonathan Nitzan (2009-2010) Imperialism and Financialism: An Exchange. London, Jerusalem and Montreal.
Nitzan, Jonathan (1996) “The ‘Dilution Effect’ and Emerging Equity Markets.” Emerging Markets Analyst 5 (1, May), pp. 12-21.
Nitzan, Jonathan (2001) Regimes of Differential Accumulation: Mergers, Stagflation and the Logic of Globalization. Review of International Political Economy 8 (2), pp. 226-274.
Nitzan, Jonathan, and Shimshon Bichler (2006) New Imperialism or New Capitalism? Review XXIX (1, April), pp. 1-86.
Nitzan, Jonathan, and Shimshon Bichler (2009) Capital as Power. A Study of Order and Creorder. RIPE Series in Global Political Economy. New York and London: Routledge.
Nitzan, Jonathan, and Shimshon Bichler (2014) “Can Capitalists Afford Recovery? Three Views on Economic Policy in Times of Crisis.” Review of Capital as Power 1 (1), pp. 110-155.
Thouvenot, Elvire (2019) “Can Capitalists Afford Economic Growth? An Animation.” Creorder Videos. https://www.youtube.com/watch?v=gTpanudMToA.
Yardeni, Edward, and Debbie Johnson (2019) Corporate Finance Briefing: NIPA vs. S&P Profits Margins. November 18 Yardeni Research, Inc., pp. 1-16.
Author contact: tookie@barak.net.il and nitzan@yorku.ca
___________________________
SUGGESTED CITATION:
Bichler, Shimshon and Jonathan Nitzan (2019) “Making America great again.” real-world economics review, issue no. 90, 9 December, pp. 2-12,
http://www.paecon.net/PAEReview/issue90/BichlerNitzan90.pdf
You may post and read comments on this paper at https://rwer.wordpress.com/comments-on-rwer-issue-no-90/