Pharmaceuticals: Beating the Hell Out of the Average
Shimshon Bichler and Jonathan Nitzan [1]
Jerusalem and Montreal, June 2021
![]() bnarchives.net / Creative Commons (CC BY-NC-ND 4.0)
bnarchives.net / Creative Commons (CC BY-NC-ND 4.0)
A lot has been written on the imminent decline of pharmaceuticals: their falling production, reduced R&D, declining innovation, the opioid crisis, patent cliffs, biting competition from generic drugs, growing opposition to IPR. The list goes on.
Top Guns
Judging by the yardsticks that matter the most, though – namely, the companies’ relative profit and relative capitalization – pharmaceuticals are doing just fine. In fact, based on these yardsticks, they remain the most powerful corporate sector of all.
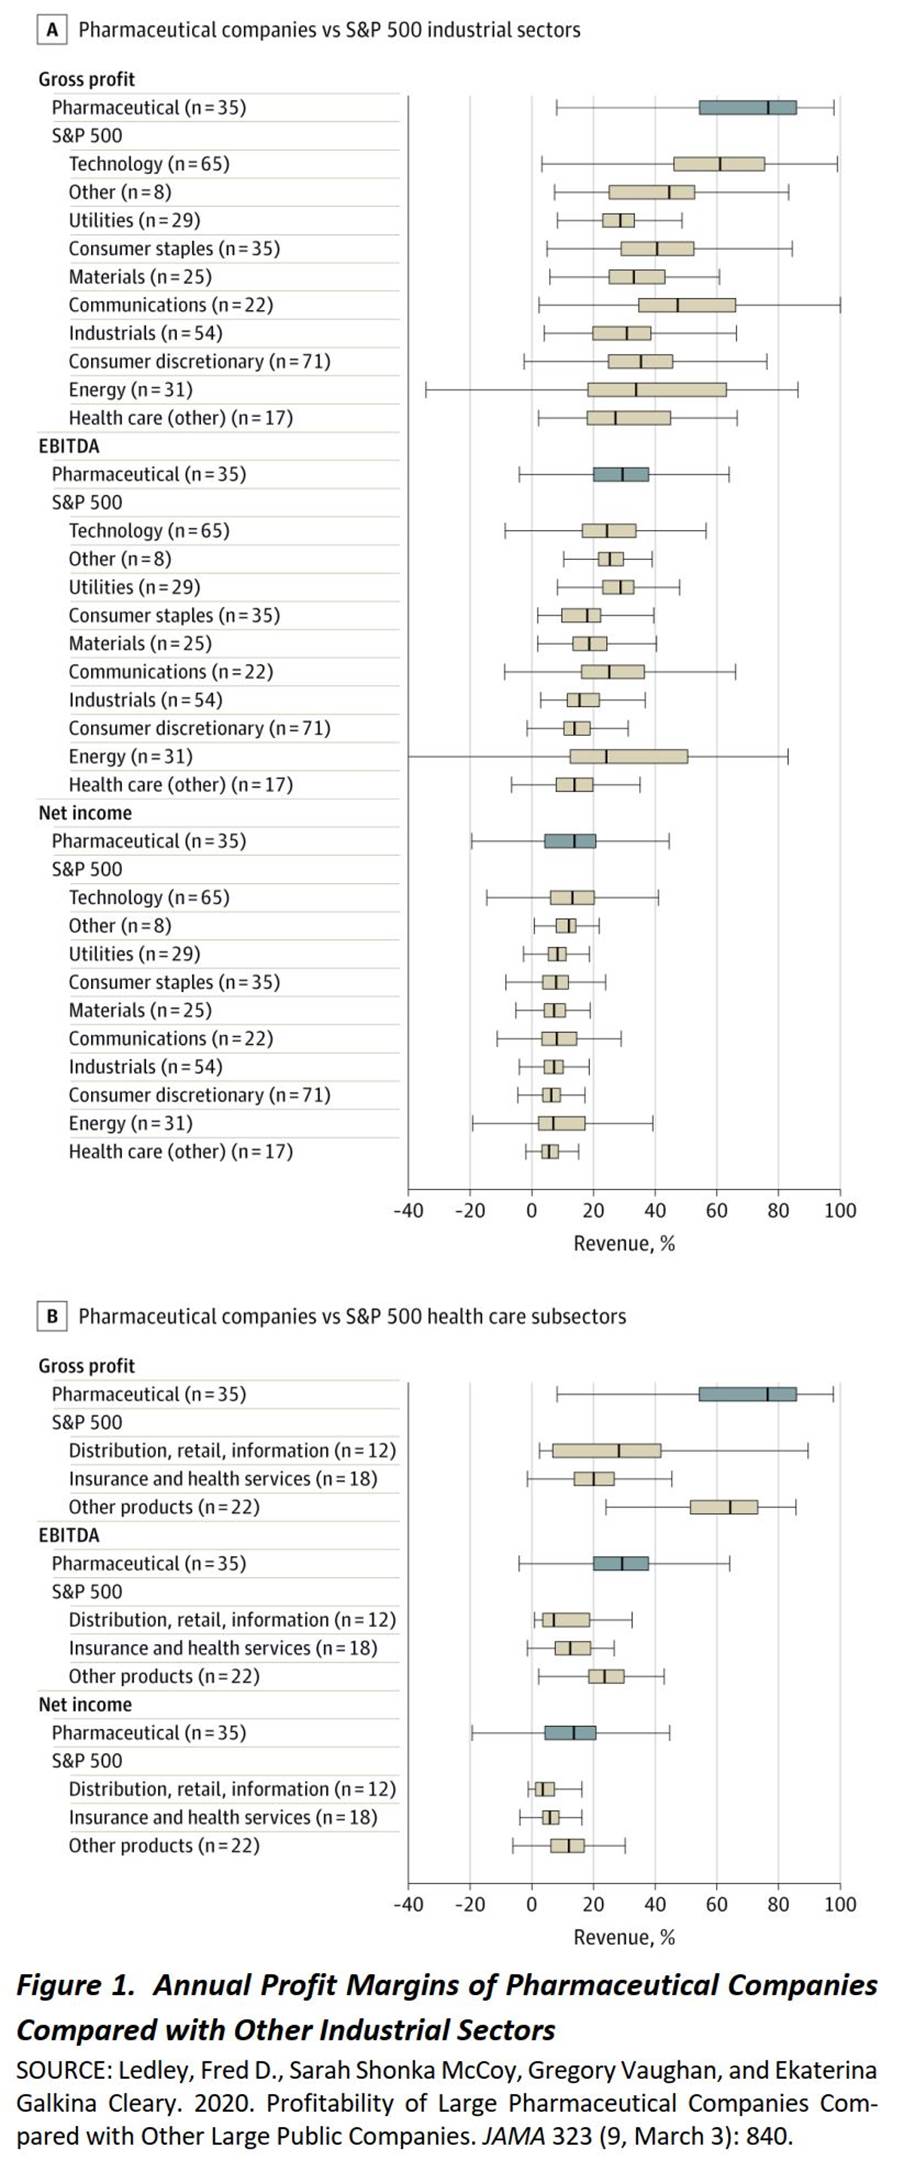
In their 2020 study, ‘Profitability of Large Pharmaceutical Companies Compared With Other Large Public Companies‘ (JAMA 323, 9, March 3, pp. 834-843), Ledley et al. show that, during the period 2000-2018, the top 35 listed pharmaceutical firms outperformed every other corporate group in the S&P 500 (with the possible neck and neck exception of technology companies).
They had higher than average: (1) gross profit margins (76.5% vs 37.4% for the remaining S&P 500); (2) EBITDA margins (29.4% vs 19%) [2]; and (3) net profit margins (13.8% vs 7.7%). They also did better on all three margins than every other corporate subsector in the S&P 500, including non-pharmaceutical health-care firms.
Figure 1, taken from Ledley et al., visualizes this systematic out-performance.
But is this top position sustainable? Can pharmaceuticals retain their top-gun status, or has their power peaked and is about to decline?
The Global View
The future, of course, is unknowable, but as far as the capitalists and their agents who own, sell, buy and price the shares of these firms are concerned, the outlook for pharmaceutical power is positive, not negative: in their opinion, it will continue rising.
This conclusion is implicit in Figure 2. The chart, which is taken from our work-in-progress on the subject, offers a global overview. It plots the distributive share of listed pharmaceutical firms in the net profit and market capitalization of all listed firms in the world.
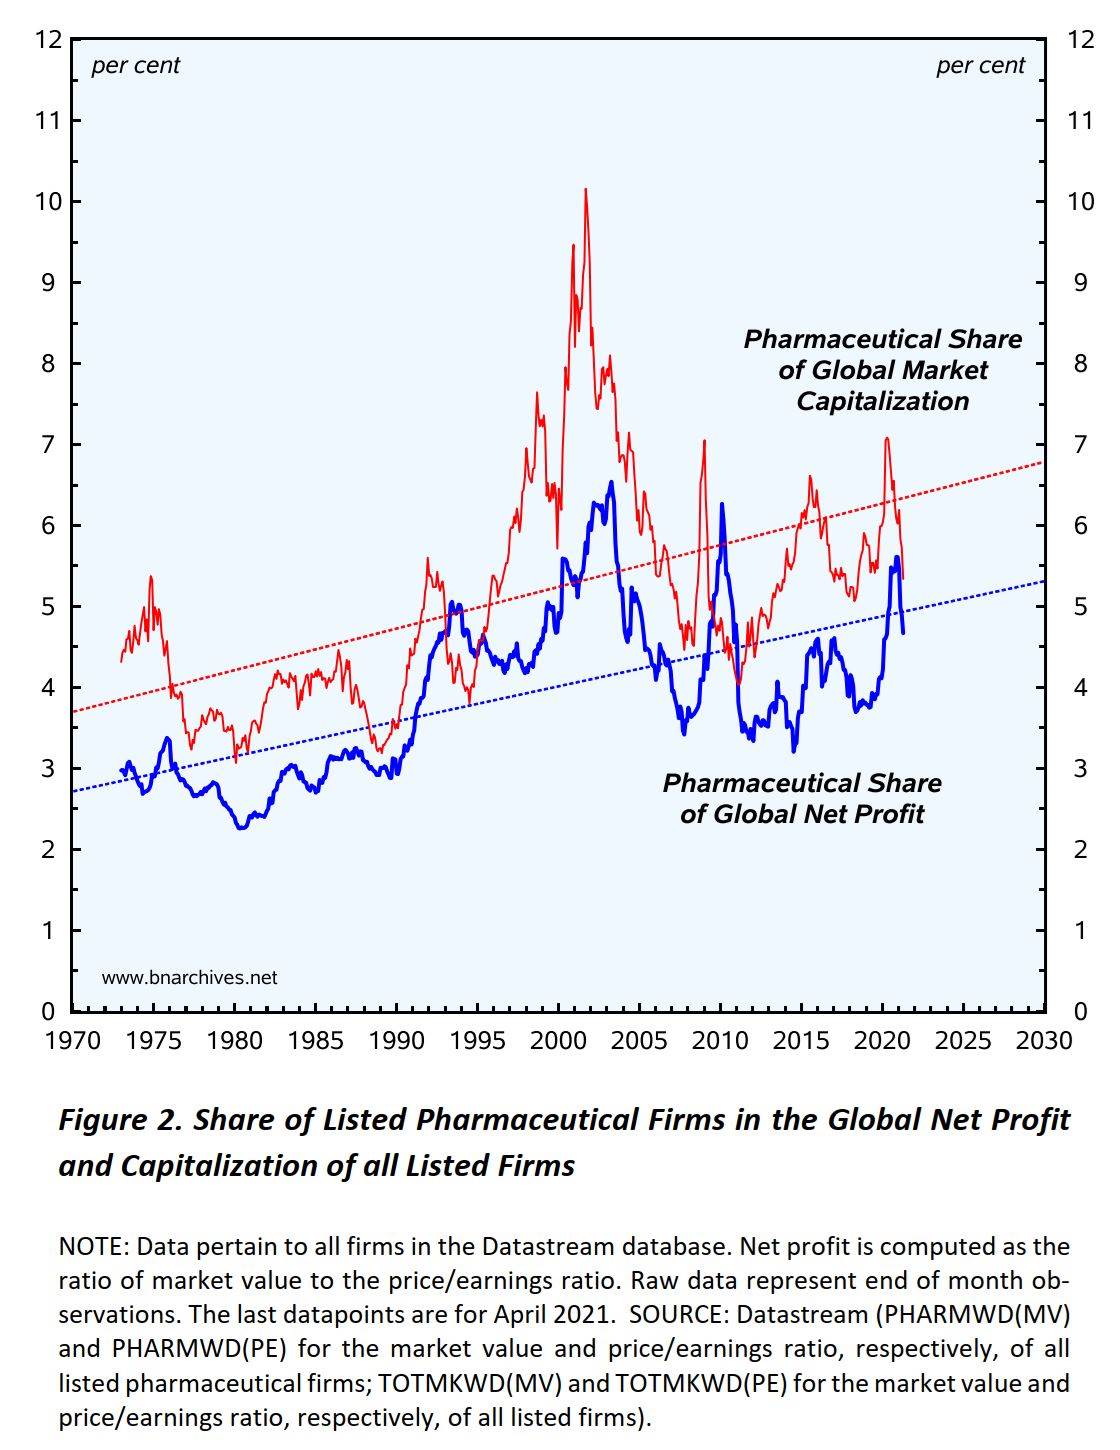
The chart indicates that, over the past half century:
1. both shares have trended upward (i.e., on average, pharmaceutical net profit and market capitalization have grown faster than global net profit and market capitalization, respectively);
2. the shorter-term movements of the two shares have been positively correlated; and
3. generally, the pharmaceutical share of market capitalization has been greater than its share of net profit (the thin red line is almost always above the thicker blue line).
These findings – particularly the third – offer insight into what capitalists, taken as group, think about the future of pharmaceuticals.
The Capitalist Outlook
Market capitalization is a forward-looking ritual. It is determined by (1) capitalists’ expectations about future earnings, (2) their perceptions of future risk proxied by earnings volatility, and (3) the normal rate of return they use to discount expected, risk-adjusted future earnings to their present value. Equation 1 summarizes this ritual:
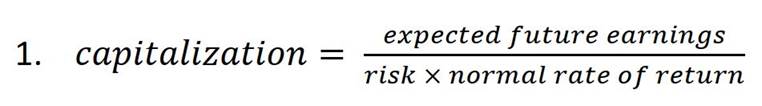
According to the equation, capitalization is affected positively by expected future earnings and negatively by expected risk and the normal rate of return. Restated in everyday language, it means that if earnings expectations rise, so will capitalization, and that if risk and/or the normal rate of return increase, capitalization will fall.
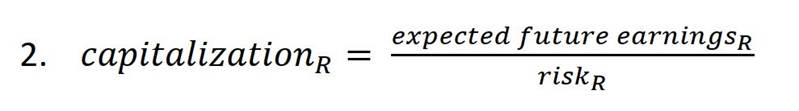
The same ritual, with one minor modification, applies to relative magnitudes. Relative market capitalization – in this case, the market capitalization of pharmaceuticals divided by the market capitalization of all firms shown by the thin red line in Figure 2 – is determined by capitalist expectations about relative future earnings (pharmaceutical compared to all firms) and relative risk (pharmaceutical relative to all firms). Since the normal rate of return used to discount risk-adjusted earnings expectations is the same for all firms, it drops from the calculation and has no bearing on relative capitalization. Using the subscript R to denote relative magnitudes (in this case, pharmaceutical relative to all firms), we get:
And here the relationship between the two series in the figure becomes important. The fact that the pharmaceutical share of global market capitalization (thin red series) is almost always larger than that the pharmaceutical share of net profit (thicker blue series) means that capitalists are willing to pay more for a current dollar of pharmaceutical net profit than for a current dollar earned by other firms. And this willingness to pay more for pharmaceutical net profit here and now means that capitalists expect (1) future pharmaceutical net profit to grow faster than global net profit, (2) future pharmaceutical risk to fall relative to global risk, or (3) some combination of the two. [3]
All in all, then, in the collective capitalist mind pharmaceutical companies are not about to decline, let alone fall into a protracted crisis. As far as capitalists are concerned, pharmaceutical profitability will continue to rise faster than the average, become less risky, or both.
[To be continued]
Endnotes
[1] Shimshon Bichler and Jonathan Nitzan teach political economy at colleges and universities in Israel and Canada, respectively. All their publications are available for free on The Bichler & Nitzan Archives (http://bnarchives.net). Work on this note was partly supported by SSHRC.
[2] Earnings before interest, taxes, depreciation and amortization.
[3] Some observers argue that investors capitalize not the company’s expected net profit but its expected ‘free cash flow’, which, in the case of pharmaceuticals, they say, tends to be disproportionally higher due to the accounting classification of some R&D spending as cost. The data, though, do not support this claim. They show that the pharmaceutical share of global free cash flow, just like its share of global net profit, is lower than its share of global market capitalization. Furthermore, and importantly, they show that, unlike the pharmaceutical share of global net profit which trends upward, its share of global free cash flow trends downward.