| 16 | Depth |
Husbandman: I think it is long of you gentlemen that this dearth is, by reason you enhance your lands to such an height, as men that live thereon must needs sell dear … or else they were not able to make the rent again.
Knight: And I say it is long of you husbandmen, that we are forced to raise our rents, by reason we must buy all things so dear that we have of you … which now will cost me double the money. . . .
—From a sixteenth-century text, A Discourse of the Common Weal of this Realm of EnglandQuoted in Leo Huberman’s Man’s Worldly Goods
The farmers and knights of the sixteenth century could be forgiven for failing to understand the universal ‘laws’ of inflation. They didn’t realize that their own local problems in fact were part of a much bigger global process. They were oblivious to the influx of precious metals and ignorant of the growing importance of credit and capitalization. They had no comparative data to look at and no in-house economists to ‘interpret’ them. In fact, as far as they were concerned, inflation didn’t even exist. There were only increases in prices. The term ‘inflation’ came into common use only three centuries later.
Nonetheless, these illiterate sixteenth-century folks were smart enough to see what many present-day economists wish we forgot — namely, that inflation is a conflictual process of redistribution. The prices that the farmers charged were costs for the knights, while those that the knights set were costs for the farmers. Both hiked their prices, but never at the same rate. And this differential meant that those who raised their prices faster redistributed income from those who did so more slowly.
But the inflationary struggle isn’t simply a tug-of-war between ‘independent’ individuals or groups in society.267 It is an entire regime, an encompassing political process of transforming capitalist power. Note that inflation per se is much older than capitalism. As we have seen, prices already existed in the early civilizations and were leveraged and manipulated well before the arrival of capital. But capitalism is the first mode of power to be overwhelmingly denominated in prices. And hence it was only with the rise of accumulation that inflation could emerge as a key aspect of the social creorder; and it was only in the twentieth century, with rise of large organized units, that inflation became a defining feature of the state of capital. The purpose of this chapter is to examine some of the ways in which prices and inflation assume this role through the process of differential accumulation.268
Depth: internal and external
One of the more flexible features of the capitalist mega-machine is the ability to increase power indirectly as well as directly (Equation (4) in Chapter 14). Capitalist power, exerted over society as a whole, is coded in the level and pattern of differential earnings. As we have seen, dominant capital can broaden this power directly by making its organization grow faster than the average. But there is also the other, indirect route of deepening the elemental power of its organization. Whereas breadth hinges on the number of employees in the corporate organization, depth depends on earnings per employee — a measure of the corporation’s ability to leverage its organizational power over society as a whole.
Of these two methods, the former is the more effective. Operating primarily through mergers and acquisitions, it can generate enduring large-scale increases in capitalized power. Yet amalgamation isn’t always feasible; and when breadth occasionally recedes, dominant capital has to resort to depth — or risk differential decumulation. It is through this latter process that price changes and inflation come into the accumulation picture.269
Let’s look at the depth process more closely. Earnings per employee can be decomposed into three elements associated with the number of units produced/sold by the corporation (indicated by the term ‘units’).270 These include (1) unit price, (2) unit cost and (3) units per employee:
\[\begin{equation} \begin{split} earnings~per~employee =&~ \frac{earnings}{employment} \\ \\ =&~ \frac{earnings}{units} \times \frac{units}{employment} \\ \\ =&~ unit~earnings \\ &\times units~ per~employee \\ \\ =&~ \left(unit~price - unit~cost \right ) \\ &\times units~per~employee \end{split} \tag{1} \end{equation}\]According to this equation, dominant capital can increase its differential depth by some combination of the following: (1) raising the number of units sold per employee faster than the average; (2) lowering unit cost faster than the average; (3) increasing unit price faster than the average.
Most political economists emphasize the first two methods and deemphasize if not reject the third. In the race for accumulation, they argue, the ultimate winners are those whose inputs are the most efficient and least expensive. That’s the ABC of economic survival. It is of course true, the argument continues, that ‘monopolistic’ firms sometimes can increase their profits by charging higher prices, but this practice is secondary and ephemeral. According to received convention, excessively high prices send buyers in search of cheaper substitutes; the excess profits generated by high prices attract competitors; and finally, there is always Schumpeter’s creative destruction and the onslaught of innovations that even the strongest monopolist cannot withstand.
All of this seems common sense — but, then, what looks sensible from the viewpoint of conventional political economy often gets inverted by differential accumulation. In Chapter 15 we saw that, contrary to common belief, dominant capital benefits much more from mergers and acquisitions than from green-field growth. And in the present chapter we’ll see a similar inversion with respect to prices: it turns out that raising prices is far more important for dominant capital than cutting costs.
Cost cutting
To clarify, it’s not that the economists are wrong about cost cutting. The conflictual dynamics of capitalism, persistent even in the presence of oligopoly and monopoly, imply a constant pressure to raise the ‘productivity’ of the inputs and lower their prices.271 This dual pressure, identified by the classical economists and reiterated by all subsequent schools, critical as well as conservative, seems beyond dispute.
And yet, from the viewpoint of differential accumulation, cutting cost is much like ‘running on empty’. It helps dominant capital meet the average, not beat it. Admittedly, this latter claim isn’t easy to test. The problem is that conventional data on productivity and input prices are rarely if ever broken down by firm size, so it is impossible to know whether and to what extent larger firms beat the average on either count. But the claim can be assessed indirectly, and the roundabout evidence seems consistent with the ‘running-on-empty’ thesis.
‘Productivity’ gains
Begin with ‘productivity’. Analytically, the number of units sold per employee (denoted by ‘units per employee’) can be written as the ratio between sales per employee and unit price:
\[\begin{equation} \begin{split} units~per~employee &= \frac{units}{employees} \\ \\ &= \frac{sales / employees}{ sales/units} \\ \\ &= \frac{sales~per~employee}{unit~price} \end{split} \tag{2} \end{equation}\]Using this equation, we can approximate the performance of dominant capital relative to the corporate sector as a whole.
Our proxy for dominant capital here is the Fortune 500 group of companies (an alternative to the Compustat Top 100 from Chapter 14). Over the past half-century, sales per employee in the Fortune 500 group and in the corporate universe have grown more or less in tandem. The ratio between the Fortune 500 and the corporate universe was 1.4 in 1954; it fell gradually to 1.1 by 1969; and from there it rose steadily, reaching 1.7 by 1993 (with the latter increase probably partly reflecting the growing significance of outsourcing by large firms).272 The overall change from 1.4 in 1954 to 1.7 in 1993 represents a 20 per cent increase — miniscule when compared to the nineteenfold increase in differential profit per firm recorded over the same period (Figure 14.2). It also seems reasonable to assume that the prices charged by larger firms haven’t fallen relative to those of smaller ones (and have possibly increased) — particularly since, as we show in the next section, inflation has tended to work in their favour.273
Now relate these two long-term developments to Equation (2). Since differential sales per employee rose only marginally while differential prices haven’t fallen and have probably risen, it follows that ‘productivity’ gains by dominant capital were more or less the same as the social average.
The difficulty of securing differential ‘productivity’ gains shouldn’t surprise us. Even if we ignore the hologramic nature of technology and focus only on the presumable ‘in-house’ development of production techniques, there is still no reason to expect large firms to be better in such development than small ones.
For instance, many of the current advances in bio-technology, information and communication are reported by smaller companies, some with only a handful of employees. Dominant capital is often unable to match this flurry of innovation. In many cases, large firms find it cheaper to let smaller companies incur the R&D cost and then buy the more promising startups — sometimes just to keep their technology from spreading too quickly.274
Moreover, and probably more importantly, production techniques, regardless of who develops them, are notoriously difficult to monopolize. Unlike final commodities that can often be protected through patents, copyrights and other exclusionary threats, improvements in the social organization of production tend to proliferate easily, and this rapid spread quickly dilutes the initial advantage of whoever implemented them first.
Input prices
The other route to cutting costs is to lower the prices of the inputs. Yet, here too it is very difficult to translate absolute reductions into differential reductions. For a start, even the largest firms have only limited control over their input prices, particularly with the proliferation of ‘outsourcing’ and long ‘production chains’. The challenge to differential accumulation of universal input prices was summarized neatly by the former chairman of Intel, Andrew Grove:
How do you build a company when your buyers are infinitely knowledgeable and where your suppliers maintain a level playing field for your competitors? What remains your competitive differentiator or your source of value or whatever academic cliché you want to wrap around it?
(Byrne 2000)
Furthermore, even when large firms do control input prices, the benefits quickly tend to spill over to other firms. Thus, a wage freeze by dominant capital groups in the United States would empower smaller firms to follow suit; political pressure by automobile companies on the Indian government to subsidize oil would benefit all energy users; a British importer winning a tariff reduction gives competing importers a free ride, etc.
All in all, then, cost cutting is a poor differential tactic. Dominant capital has to pursue it with much zeal, lest it falls behind; but it can rarely use it to get ahead.
Stagflation
The road to differential depth is not to cut cost but to inflate prices. As we shall see, inflation often redistributes income from wages to profits and from small to large firms; it elevates the differential earnings per employee of the leading corporations; and it deepens the ‘elemental power’ of dominant capital.
But the process is full of puzzles. First, there is the general theoretical conundrum. Conventional theory associates inflation with growth, yet reality usually brings inflation together with stagnation. Since this combination is not supposed to happen, economists decided to contain the damage by giving it a special name. They called it ‘stagflation’ — an anomalous mixture of stagnation and inflation that shouldn’t be confused with ‘normal’, growth-driven inflation (growthflation?).275
And then there is our own bizarre proposition that stagflation, whether normal or anomalous, fuels the differential accumulation of dominant capital. Most readers will probably find this suggestion somewhat difficult to swallow. How could firms gain from a combined crisis of rising prices, stagnating production and falling employment? Why should this crisis benefit larger firms relative to smaller ones? And if stagflation is so beneficial to the most powerful groups in society, why don’t we have it all the time? Clearly, there are many questions to sort out here, so it is worthwhile to backtrack a bit and provide some context.
The historical backdrop
To start with, there seems to be a general neglect, including among critical political economists, of the historical significance of inflation for capitalist development. On the face of it, this neglect is rather surprising. Inflation — commonly defined as a general rise in the price of commodities — is hardly new. According to David Hackett Fischer (1996), since the thirteenth century there have been no less than four major inflationary waves, or ‘price revolutions’ as he calls them. Figure 16.1 illustrates the pattern of these waves in the UK, a country whose price indices go back the farthest (note the log scale).276

Figure 16.1: Consumer prices in the UK, 1271–2007
Source: Till 1948, data are from Global Financial Data (series code: CPGBRM); from 1949 onward, data are from International Financial Statistics through Global Insight (series code: L64@C112).
The first wave occurred during the thirteenth century; the second during the sixteenth century; the third in the latter part of the eighteenth century; and the most recent began in the early twentieth century and is still going. As Fischer argues, each of these price revolutions was accompanied, particularly toward the latter part of the wave, by a deepening socio-economic crisis. In other words, the ‘anomaly’ of inflation in the midst of stagnation is not a twentieth-century novelty. It’s been with us for half a millennium, if not more.
Now, to be fair to the classical political economists, the specific backdrop against which they were writing was largely one of price stability and even deflation — not inflation. As shown in Figure 16.1, UK consumer prices had hardly changed between 1600 and 1750. In the second half of the eighteenth century they rose relatively quickly, but then fell again throughout the nineteenth century. Between 1800 and 1900 — a formative period of political economy — consumer prices in Great Britain and wholesale prices in the United States both dropped by more than one third.277 In this deflationary context, it was only natural to concentrate on production and the coercive discipline of ‘market forces’ and to ignore inflation.
However, the historical backdrop changed dramatically during the twentieth century. First, inflation has risen to unprecedented levels. As Figure 16.1 shows, UK prices rose by nearly 6,000 per cent between 1900 and 2007, compared with less than 800 per cent in the previous six centuries combined.278 Second, there was a clear change in pattern. Whereas during pervious waves prices oscillated around their uptrend, in the twentieth century — with the notable exception of the 1930s — they moved only up.279
The classical political economists, writing in a different era, perhaps could be excused for not paying too much attention to inflation. But having lived through the experience of the twentieth century, contemporary observers cannot ask for similar leniency.
Neutrality?
Of course, modern political economists don’t deny that inflation exists, and some even agree that it may have short-term consequences. But in the opinion of most, all of this is much ado about nothing. In the long run, inflation has little or no effect. It is ‘neutral’.
And why this insistence on ‘neutrality’? The reason goes back to David Hume’s ‘classical dichotomy’. As we have seen earlier in the book, political economists follow this dichotomy to separate the ‘real’ and ‘nominal’ spheres of economic life. Of these two, the ‘real’ sphere of production, consumption and distribution is considered primary; the ‘nominal’ sphere of money and absolute prices is thought of mostly as a lubricant, a mechanism that merely facilitates the movement of the ‘real economy’. And since money prices are ‘nominal’ and therefore do not impinge on the ‘real’, their overall inflation (or deflation) must be ‘neutral’, by definition.280
Aggregates
The belief that inflation is ‘neutral’ is greatly facilitated by the way economists define it. There are two common definitions: (1) inflation as a continuous increase in the average price level; and (2) inflation as an ongoing increase in ‘liquidity’; that is, an increase in the total amount of money relative to the total volume of commodities.
These two definitions are often seen as equivalent: if we derive the average price level P as the ratio between the total amount of money M and the overall ‘quantity’ of commodities Q (ignoring the velocity of circulation), it is obvious that in order for the average price P to rise (or fall), the liquidity ratio M/Q has to rise (or fall) at the same rate, and vice versa.281 In this strict sense, Milton Friedman is correct: inflation indeed is ‘always and everywhere a monetary phenomenon’, by definition. But inflation is never only a monetary phenomenon.
Disaggregates
The important thing to note here is the aggregate perspective: the conventional definition focuses wholly and only on averages and totals. This fact is crucial, since to define inflation in this way is to miss the point altogether.
Inflation certainly involves a rise in the average price of commodities; but that is like saying that the average outcome of a game between two basketball teams is always a draw: one team’s win is another’s loss. Although mathematically correct, the statement is irrelevant to the reality of basketball games. If these games always ended up in a draw, players would soon be looking for another game — one that they could actually win. Similarly with inflation. If all prices rose at the same average rate, inflation definitely would be ‘neutral’, as mainstream economists say. But it would also serve no purpose whatsoever and hence cease to exist.
The crux of inflation is not that prices rise in general, but that they rise differentially. Inflation is never a uniform process. Although most prices tend to rise during inflation, they never rise at the same rate. There is always a spread, with some prices rising faster and others more slowly. From this viewpoint, the engine of inflation is a redistributional struggle fought through rising prices. The overall level of inflation is merely the surface consequence of that struggle.
So in the end, Milton Friedman is right — but only in part. Inflation is always and everywhere a monetary phenomenon; but it is also always and everywhere a redistributional phenomenon.282
Redistribution
The difference between the two views is decisive. For those who see inflation as an aggregate ‘nominal’ process of ‘too-much-money-chasing-too-few-commodities’, indeed there is little reason to look any further into the so-called ‘real’ world of distribution. The only relevant questions are, first, how much money is created and, second, how increased liquidity is ‘transmitted’ to higher prices.
But if inflation is merely the aggregate appearance of an underlying redistributional conflict, the way to understand it is to begin from that very struggle. From this perspective, there are two important questions: (1) who are the winners and losers in the struggle; and (2) what is the broader character of that struggle? We deal with each question in turn.
Winners and losers
Inflation redistributes income in many different ways, of which we highlight two: redistribution between workers and capitalists, and redistribution between small and large firms.283
Workers and capitalists
Figure 16.2 contrasts the redistribution between workers and capitalists with the rate of wholesale price inflation in the United States over the past half-century (the insert in the top-left corner shows the period since 1985 and will be examined later). The distribution of income denotes the ratio between the earnings per share of the Standard & Poor’s 500 (S&P 500) and the average hourly wage in the private sector. The specific focus on earnings per share and the wage rate is intended to emphasize the income of individual owners — the owner of capital and the owner of labour power, respectively.
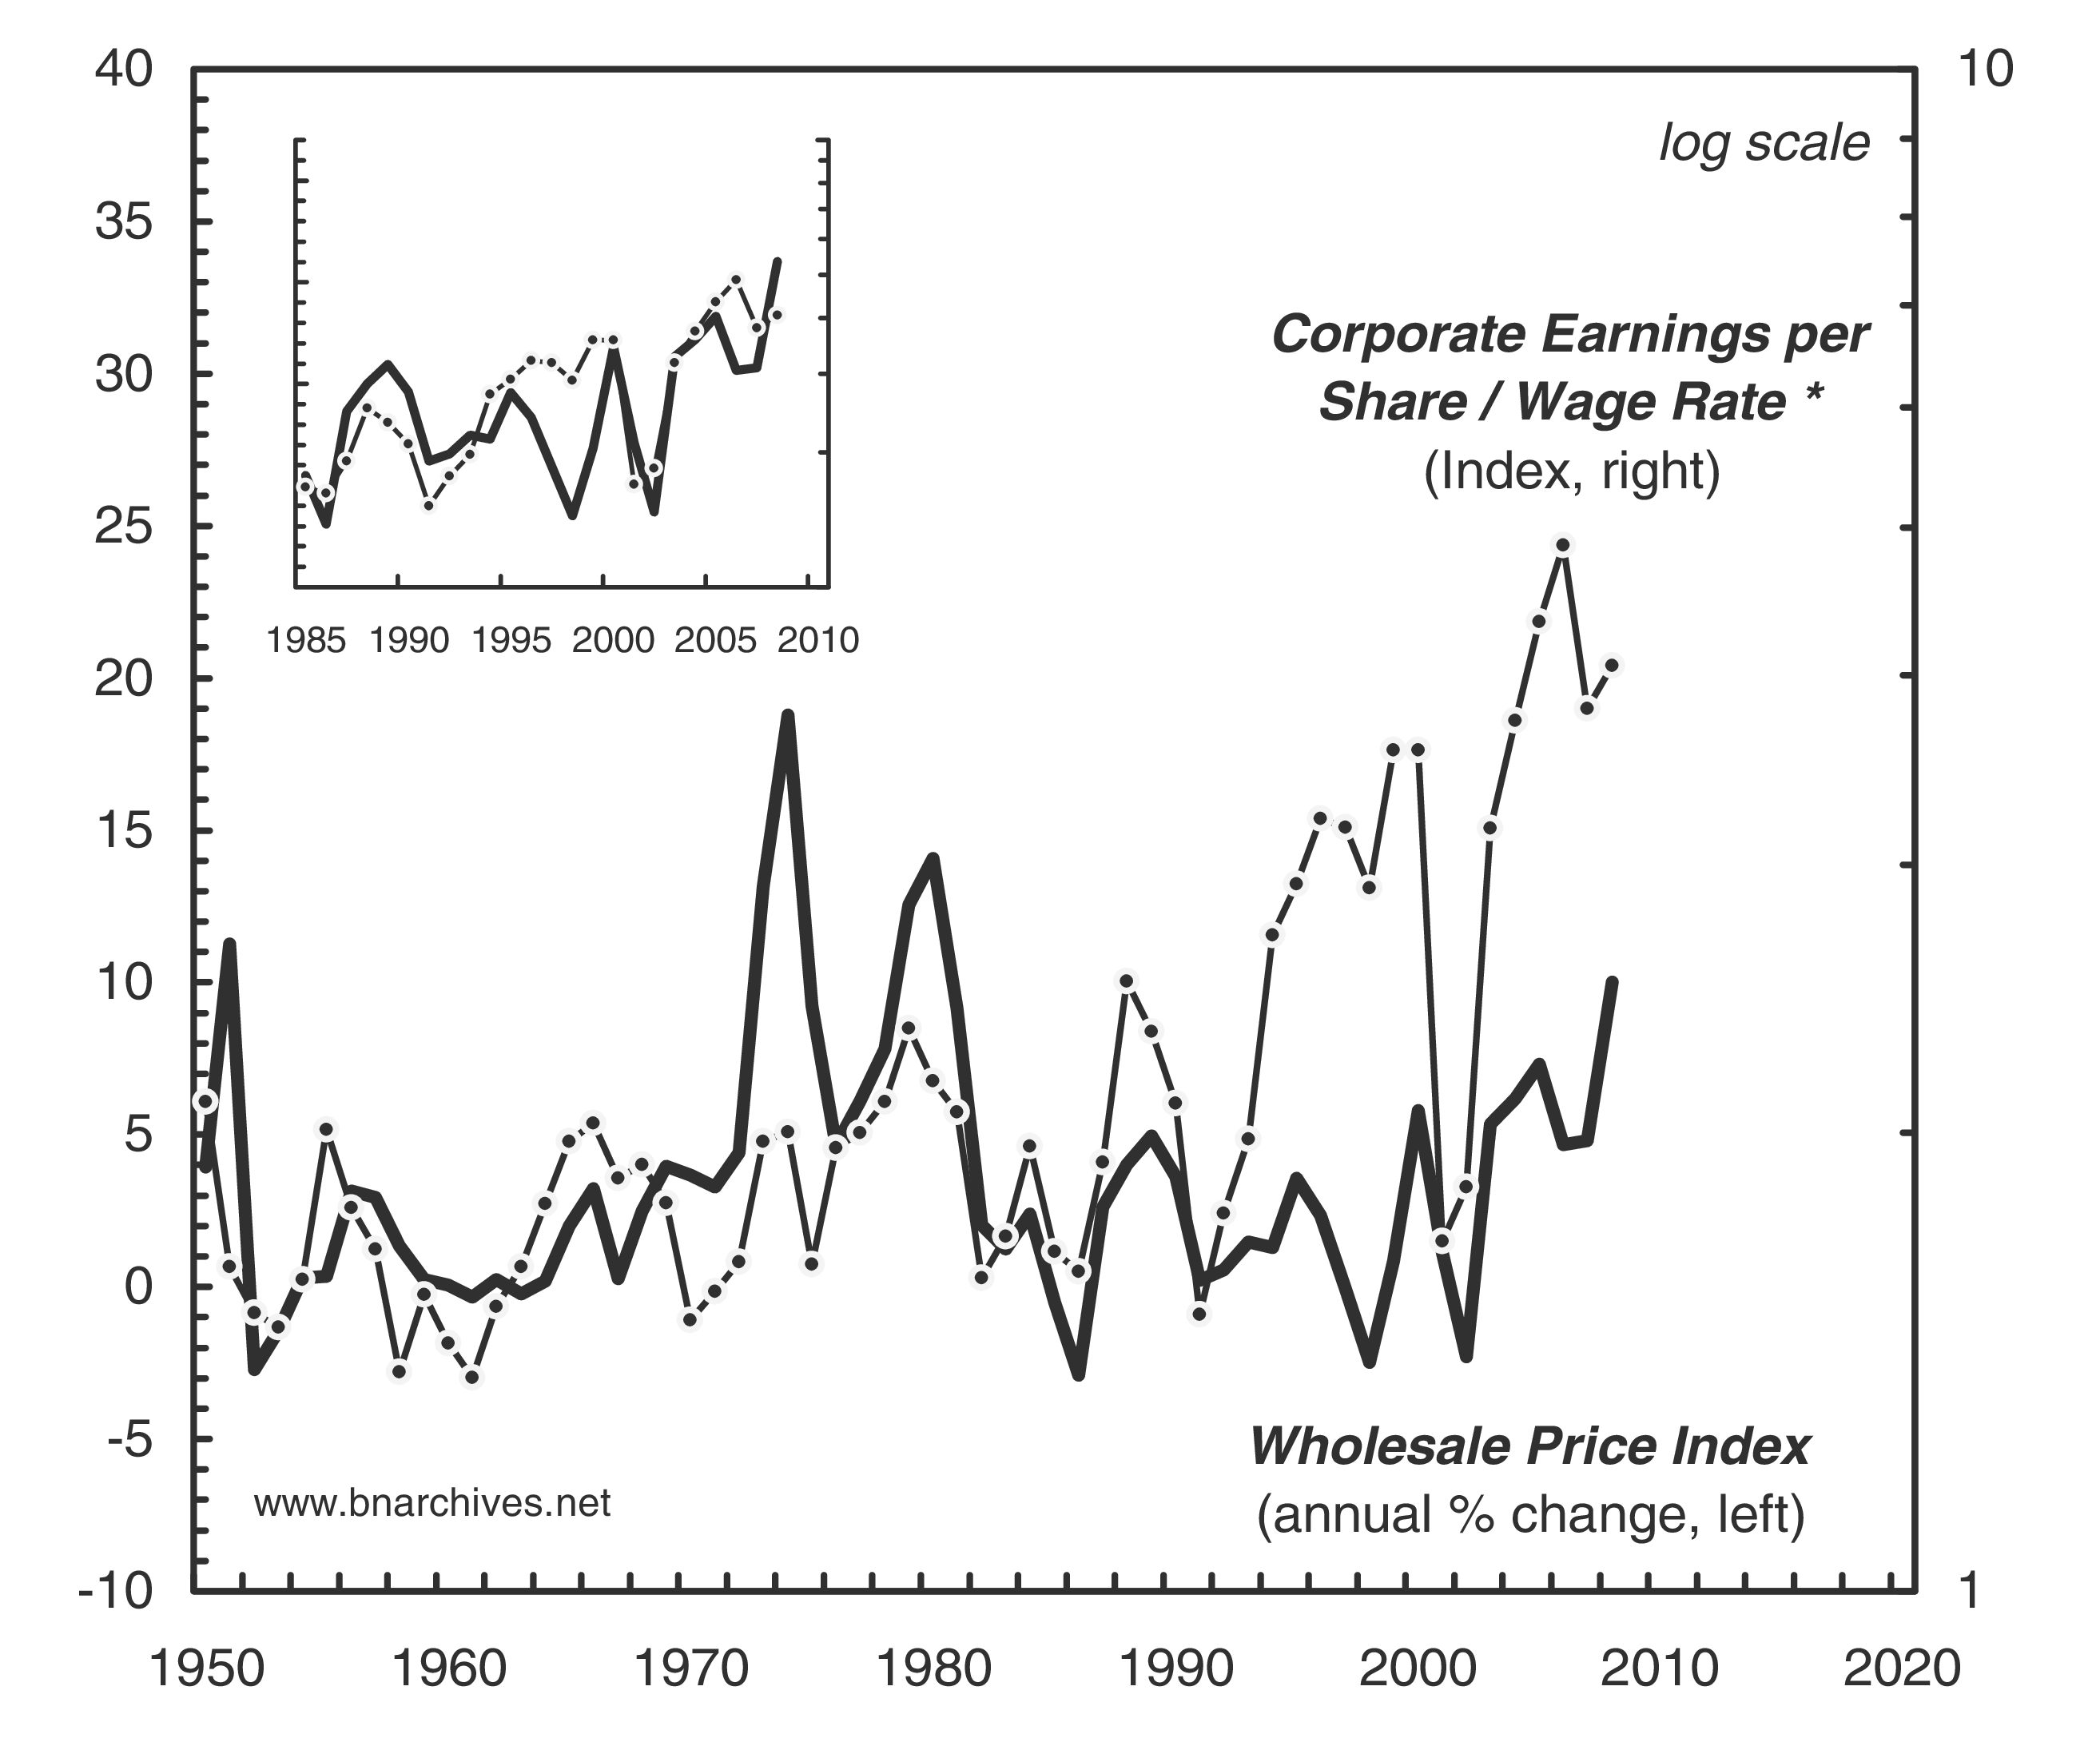
Figure 16.2: US inflation and capital–labour redistribution
* Corporate earnings per share are for the S&P 500. The wage rate is the average hourly earnings in the goods producing private sector till 1963 and in the private sector afterwards.
Source: Standard & Poor’s through Global Insight (series code: EARN500NS for S&P 500 earnings per share); U.S. Department of Commerce and U.S. Bureau of Labor Statistics through Global Insight (series codes: AHPGP and AHPEAP for the wage rate; WPINS for the wholesale price index).
Now, if mainstream economics is right and inflation is ‘neutral’, its ups and downs shouldn’t correlate with the distribution of income between workers and capitalists. The wheel of fortune would oscillate between the two groups as they alter their prices and wages at different rates. But since these are relative price changes, there is no reason for them to be systematically related to the overall nominal rate of inflation.
Unfortunately, that is not what we see in the chart. Instead of a random pattern, the data show the two series to be tightly and persistently correlated. When inflation accelerates, income is redistributed in favour of capitalists; and when inflation decelerates, the process inverts to benefit workers at the expense of capitalists. Obviously, this isn’t exactly the evidence neutrality buffs would marshal to prove their point.
Now, at first sight it seems that the correlation has loosened a bit in recent years. But this is an optical illusion. Notice that the fluctuations in the income ratio have trended upwards, particularly since the late 1980s. The main reason is that, unlike workers, the S&P 500 have gone global, drawing an increasing proportion of their profits from overseas operations (as illustrated in Figure 15.6). This global diversification caused the levels of the two series to diverge.284
Remarkably, though, even in this period of heightened capital flows and soaring foreign earnings, the fluctuations of distribution and inflation continue to move in tandem. The insert in the top-left corner of Figure 16.2 recalibrates the left-hand axis, showing that the correlation remains as positive and tight as before.285
Small and large firms
The second redistribution through inflation is between small and large firms. Given our focus on external depth, the interesting question for us concerns the earnings-per-employee ratio: can dominant capital leverage inflation in order to increase its own earnings per employee faster than the average?
The neutrality theory of inflation would say no. Relative ‘pricing power’ — assuming such power exists — is a ‘real’ variable. This relative power may rise or fall, but there is no reason for it to change with ‘nominal’ inflation, and even less reason for the change to be related to firm size. And yet, here, too, reality disrespects the theory. It turns out that US inflation has systematically and persistently redistributed earnings from small to large firms.
In this illustration we use the Fortune 500 group of companies as our proxy for dominant capital and focus specifically on net profit.286 Differential profit per employee is defined as the ratio between net profit per employee in the Fortune 500 group and in the business sector, respectively. However, as we already mentioned, Fortune stopped publishing the number of employees after 1993, so we end up with only a partial series. Fortunately, there is a close substitute: the differential markup. This indicator measures the ratio between the net profit share of sales in the Fortune 500 group and in the business sector, respectively. Over the period between 1950 and 1993, the annual oscillations of these two differential indicators looked like carbon copies of one another, with a correlation coefficient of 0.86. Assuming that this correlation continued after 1993 makes the differential markup a nearly perfect proxy of differential profit per employee.287
Figure 16.3 contrasts the differential markup of the Fortune 500 with the annual rate of wholesale price inflation. The figure demonstrates the greater ‘elemental power’ of dominant capital. Over the past half-century, the differential markup averaged 1.6, while differential profit per employee (which is not shown here) averaged 2. These numbers mean that the largest firms marked up their sales by 60 per cent more than the business average and that they earned twice as much profit per employee.

Figure 16.3: US inflation and differential accumulation
* The markup is the per cent of net profit in sales. The Fortune 500 markup is the per cent of after tax profit in sales revenues. The business sector markup is computed by dividing total corporate profit after tax with IVA and CCA (from the national income accounts) by total business receipts (from the IRS). The Differential Markup is given by dividing the Fortune 500 markup by the business sector markup.
Note: Until 1993, the Fortune 500 list included only industrial corporations (firms deriving at least half their sales revenues from manufacturing or mining). From 1994 onward, the list includes all corporations. For 1992–3, data for Fortune 500 companies are reported without SFAS 106 special charges.
Source: U.S. Department of Commerce through Global Insight (series codes: ZAECON for total corporate profit after tax with IVA and CCA; WPINS for the wholesale price index); U.S. Internal Revenue Service; Fortune.
For our purpose, though, the crucial point lies in the dynamics. Over time, the relative profit power of dominant capital tended to fluctuate; and as the data clearly show, these fluctuations have been positively and tightly correlated with the rate of inflation: dominant capital tended to beat the average when inflation rose and trail it when inflation fell.288
Further analysis in Nitzan (1992, pp. 418–22, Figures 9.15a–9.15h) demonstrates that the link between inflation and differential depth is positively related to firm size. The analysis disaggregates US-based corporations into eight groups ranked by assets size, showing that the larger the firm, the greater and more systematic its differential gains from inflation.
This systematic correlation is all the more remarkable given the prevalent practice of markup pricing discussed in Chapter 12. Much of the literature about this practice is concerned with the way firms ‘respond’ to and ‘transmit’ cost signals.289 Now, if firms merely responded to and passed on cost increases, their differential markup position would have remained the same and there would be no redistribution. Figure 16.3, though, shows that redistribution is incessant, so there must be more to markup pricing than passive reaction.
At the very least, some firms — most notably the largest — must be more ‘responsive’ than others; their more agile reaction, particularly during inflation, helps them beat the average and redistribute income in their favour. But the more plausible explanation is that these firms do not simply react passively; they take the initiative. They actively raise their prices, markup and profit per employee faster than the average, and as the ensuing redistibutional struggle unfolds inflation is ratcheted higher.
Patterns
All in all, then, it is clear that US inflation hasn’t been ‘neutral’ in the least. On the contrary, it has been associated with a systematic redistribution of income from workers to firms and from small firms to large firms. That in itself is already a good enough reason to doubt conventional inflation theory. But what is really remarkable here is that the direction of these two correlations has remained the same for half a century or more.
This point can hardly be overstated. Redistribution is a matter of power, and power can shift over time. So even if we accept that ‘inflation is always and everywhere a redistributional phenomenon’, still there is no inherent reason why it should almost always work in favour of capital in general and dominant capital in particular.
For instance, in Israel, as in the United States, workers tended to lose from inflation and large firms tended to gain at the expense of smaller ones (Nitzan and Bichler 2002: Ch. 4). But in Germany and France, two countries where labour is relatively strong, the impact of inflation on labour/capital redistribution has been far less clear (the highly aggregated nature of OECD data makes it difficult to draw conclusions regarding the performance of large versus small firms).
In principle, then, the link between inflation and redistribution has no preset pattern. Inflation itself is a tricky process; its consequences depend on the relative power of the leading firms, capital in general and labour groups, among others; this relative power can change over time and so can the distributional outcomes. In this open-ended context, the fact that the US experience has been so systematically one-sided is highly significant.
Thus, put together, the evidence presented here means that US inflation has become a very potent and fairly ‘reliable’ engine of differential accumulation. With a long history to learn from, companies know that inflation helps them raise their profit faster than it helps workers raise their wages; they know that inflation helps them more if they are large than if they are small; and they know that the process has certain regularities on which they can rely.
Accumulating through crisis
Business as usual
These considerations serve to suggest why inflation has become a permanent feature of modern-day capitalism. Recall from Figure 16.1 that the turn of the twentieth century marked the birth of a new type of inflation: relentless and rapid. And recall further that it was exactly at that point that dominant capital emerged as a key element of the capitalist creorder.
This dual rise of modern inflation and dominant capital is no coincidence. In Chapter 12 we suggested that accumulation requires sabotage, and that ‘business as usual’ for large corporations comes with a certain measure of stagnation (Figures 12.1 and 12.2). But this turns out to be only half the story. The other half is inflation. As we have seen, dominant capital benefits from inflation — relative to workers and relative to smaller firms. And, therefore, it shouldn’t surprise us that just as stagnation has become a fixture of the modern capitalist landscape, so has inflation. Putting the two processes together, we can redefine ‘business as a usual’ as a combination of stagnation and inflation, or stagflation.
The imperative of crisis
So in the end, inflation in the midst of stagnation is not an anomaly. If anything, it is the general rule. Modern capitalism is built on strategic sabotage and continued dissonance. In order to earn a profit and accumulate capital, business needs to restrict industry and limit its resonating energies. And when profit is to be increased and accumulation hastened, the sabotage often has to intensify and the dissonance deepen. That is how inflation redistributes income, and that is why the process commonly appears as a stagflationary crisis.
Naturally, most economists would reject these claims outright. Inflation, they would counter, is a monetary phenomenon and therefore has no lasting impact on the ‘real’ world. As a concession, they would readily agree that inflation can be triggered by ‘real’ variables — but certainly not by stagnation. Indeed, according to the macroeconomic canons, the most common catalyst for inflation (aside from the proverbial printing press) is ‘excessive’ economic growth.
This conviction, however, is based on a cyclical perception of supply constraints, which, valid or not, is meaningful only in the short term. Over the longer haul, capacity can be increased as needed, so ‘material’ bottlenecks are largely irrelevant. In fact, the most common ‘curse’ of rapid growth is the even faster expansion of green-field investment and the inevitable ‘glut’ that follows.290
In the long run the key to inflation is power. Since growth tends to remove its own ‘natural’ bottlenecks, these have to be actively created and instituted by the key players. Regardless of their particular form, the purpose of all such instituted restrictions is to keep overall capacity from growing too fast. Note the emphasis here on overall capacity: dominant capital may be able to keep its own production stable or even growing, but unless it manages to cap overall growth, coordination is bound to disintegrate into a price war, leading to disinflation or even outright deflation.
The upshot is simple: over the longer haul we should expect conventional measures of inflation and growth to be not positively, bu inversely related. Long-term growth, far from stoking the inflation fire, works to cool it off by undermining the ability to coordinate and exercise organized power. Inflation, on the other hand, requires slack and therefore tends to appear as stagflation.
Varieties of stagflation
Before testing this proposition, however, a final clarification is necessary. The term ‘stagflation’ has several interpretations that are not equally useful. The weak version, as per Samuelson (1974), views stagflation as inflation combined with unemployment and under-capacity utilization. The moderate version, found for instance in Baumol, Blinder and Scarth (1986), defines it as inflation combined with slow growth or recession. Finally, the strong version, adopted for example by Parkin and Bade (1986), limits stagflation to instances where inflation coincides with falling output.
For our purpose here, the weak version is not sufficiently refined. Twentieth-century capitalism was characterized by some measure of unemployment and unused capacity throughout, so its inflation was always stagflationary according to this definition. This characterization, although technically correct, doesn’t allow us to gauge the precise nature and intensity of the process. The strong version is also not very helpful, since falling overall output is relatively rare. The most useful of the three is the moderate version, particularly when understood as a relationship. If growth is positively related to inflation, stagflation is clearly an anomaly. By contrast, if the relationship is negative, stagflation must be seen as the ‘norm’: it intensifies as growth declines and inflation rises; and it recedes when growth increases and inflation falls.
The stagflation norm
Now to the facts. Figure 16.4 shows the long-term relationship between the conventional measures of inflation and economic growth in the United States, going back to 1809 (with both series smoothed as 20-year moving averages). The data show quite clearly that the relationship between the two phenomena is not positive, but negative. Low inflation is associated with high growth, whereas high inflation is commonly accompanied by stagnation — the very opposite of what conventional theory wants us to believe. And this inversion is hardly limited to the United States. In fact, during the post-war period the negative correlation between growth and inflation has become the rule rather than the exception, reproducing itself in country after country, developed as well as developing (see for example, Nitzan 1995a; Nitzan and Bichler 2002: Figure 2.8, p. 71).
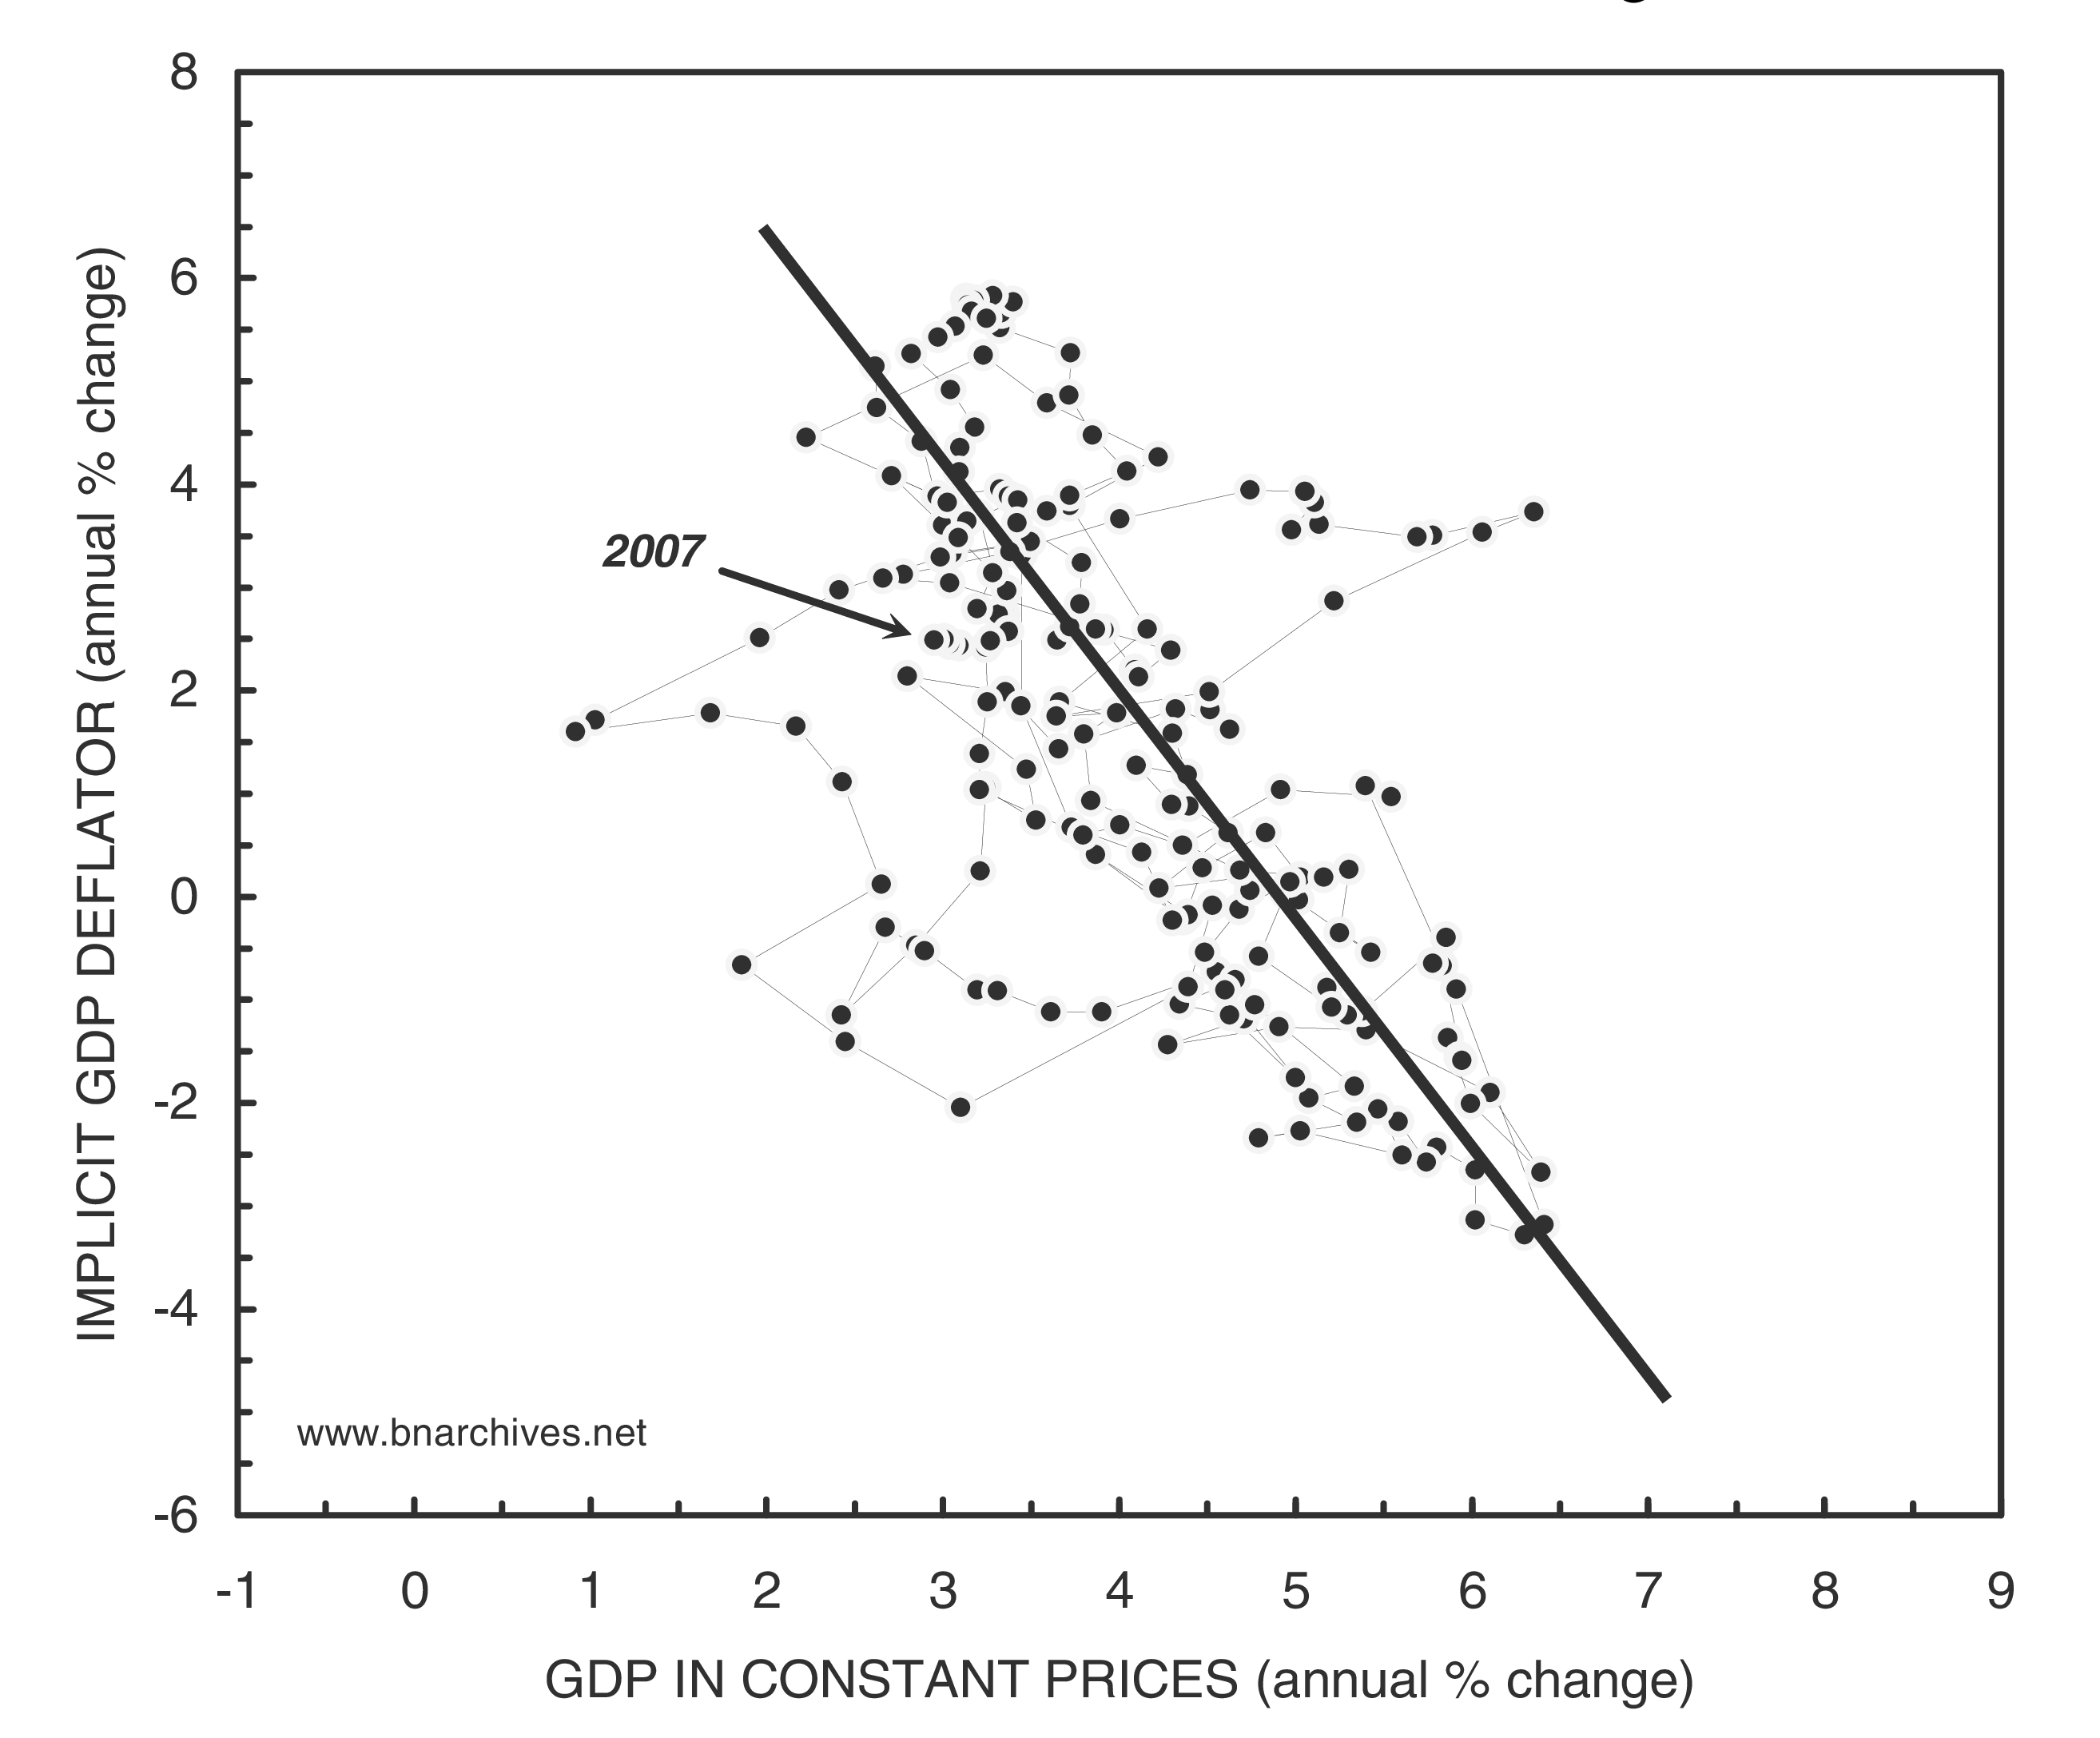
Figure 16.4: United States: inflation and growth, 1809–2007
Note: Series are shown as 20-year moving averages. The straight line running through the observations is drawn freehand for illustration purposes.
Source: Historical data till 1928 are from Global Financial Data. From 1929 onward, data are from the U.S. Department of Commerce through Global Insight (series codes: GDP for GDP; PDIGDP for the implicit GDP deflator).
At this point, the reader may wonder: if stagflation is the norm and prices tend to rise in the midst of slack, the implication is that there is no ‘material’ scarcity; but, then, if there is no ‘real’ shortage, why are buyers willing to pay higher prices?
The short answer is that usually they are not willing; they are forced. And the way to force them is by creating, imposing and maintaining various forms of social crisis, apparent or real. Military hostilities during the First World War, the reparation crisis of Germany in the 1920s, the global oil crises of the 1970s, rising unemployment in Israel during the 1980s, political instability in Russia in the 1990s, debt default in Argentina in the early 2000s and ‘peak commodities’ in the late 2000s are all illustrations of such inflation-triggering crises.291
The effect of these crises on inflation is twofold. On the one hand, they undermine the ability of most people to resist price increases. On the other hand, they enable a consensus to emerge within dominant capital that inflation can be used with relative impunity. In this sense, stagflation is the macroeconomic appearance of ‘accumulation through crisis’. Unemployment and stagnating production, along with other forms of instability, conflict and force, constitute the necessary backdrop for differential accumulation through differential inflation.
The hazards of inflation
However, stagflation isn’t always a bonanza for dominant capital. We have already seen that although some stagnation is necessary for accumulation, excessive stagnation undermines it. And the same holds true for inflation: in small doses it boosts accumulation; in overdoses it can easily undermine it.
Capitalization risk
So far, our discussion has focused on the benefits of inflation for differential earnings; but we shouldn’t forget that differential earnings are merely a means to the higher end of differential capitalization. Now, it is true that earnings are the most important elementary particle of capitalization, particularly over the longer run — but they are not the only factor. In addition, there is also hype, risk and the normal rate of return. These particles are also affected by inflation — though sometimes in ways that dominant capital doesn’t find attractive.
The most important factor to consider here is risk. Note that although differential earnings rise with inflation, the gains are always short-lived: they last only as long as the underlying bout of inflation continues. Indeed, it seems that the only way to keep such gains coming is to keep inflation going; and if the gains are to be raised, inflation needs to be accelerated.
Although such acceleration occasionally happens, and often with the desired differential impact, it cannot last indefinitely. As illustrated repeatedly in history and across the world, inflation is a risky business. It is difficult to manage; it often degenerates into an uncontrollable spiral; and its consequences — for dominant capital specifically and for the capitalist order more broadly — are hard to predict.
This unpredictability can wreak havoc on differential capitalization. If the perceived increase in risk for dominant capital exceeds that of the business sector, the negative effect can outweigh the positive gain in differential earnings, causing differential capitalization to decline.
The politics of inflation
And that isn’t all. Inflation destabilizes society. The architecture of capitalist power is denominated in prices; and inflation, by changing absolute and relative prices, constantly alters that architecture. This reshuffling makes the political underpinnings of inflation dangerously overt.
The situation is very different from that of breadth. As we have seen, mergers and acquisitions have a long-lasting and often dramatic impact on the organization and ideologies of power. From the viewpoint of the proles, though, the process seems confined to the upper echelons of society. The media convince them that amalgamation is necessary for ‘economies of scale’ and ‘national competitiveness’, and that the financial aspects of the process are too difficult for them to comprehend anyway. And since the resulting consolidation seems to have little direct bearing on the day-to-day existence of the underlying population, few find reason to resist it — let alone to do so politically.
This sales pitch cannot work with inflation. The mechanisms of inflation, much like those of mergers and acquisitions, are political in the widest sense of the term. They are intimately dependent on the power institutions and policies of the state of capital and on the government organs that facilitate and administer them. But unlike amalgamation that comes covered in a soft glove, inflation delivers a raw punch. And this naked force makes the ‘politics’ of the process far more obvious.
Since redistribution here leverages the entire structure of prices, it has an immediate bearing on everyone. The winners and losers are evident, and their conflict is open for all to see. The underlying population, impartial to breadth, is almost always hostile to depth. It starts to resist and fight back; it calls for political changes; it demands to rein in the leading corporations; and it wants to be compensated by higher wages. And as the struggle intensifies, so does the inflationary spiral, causing the crisis to deepen and instability to heighten.
The government, seemingly ‘unable’ to stop the process, is blamed as a culprit and risks losing its legitimacy as a ‘neutral’ body. The stability of the currency, measurement habits, the law, morals and justice are all thrown into question. The ruling class itself starts to bicker over the spoils of the process, over how to manage it and over whether or not to terminate it. And as the process intensifies and its character politicizes, there arises the risk that the very supremacy of capital will be called into question.292
Stop-gap
For these reasons, inflation is more of a stop-gap option for dominant capital. In contrast to mergers and acquisitions whose differential impact is slower to develop, the gains from inflation have no upper technical bound (as illustrated by episodes of hyperinflation). But these benefits come with mounting ‘risks’ which the large owners and leading government officials are often hesitant to take.
From the viewpoint of dominant capital, therefore, inflation is forever a double-edged sword. Effective but highly dangerous, it is not the weapon of first choice. It is only when the gains from breadth dry up that dominant capital, seeing its differential accumulation undermined, moves reluctantly toward relying on inflationary redistribution.
Policy autonomy and the capitalist creorder
The negative long-term correlation between growth and inflation helps to contextualize the post-war schizophrenia of ‘policy makers’. Their stated purpose (with an emphasis depending on whether they sit in the finance ministry or central bank) is always the same: to promote growth and assure price stability. Their latent commitment, though, is far more flexible and seems to have progressively drifted in favour of differential accumulation.
During breadth periods, the stated and latent goals are consistent, with high growth and low inflation allowing ‘policy makers’ to do little and claim success. The problem arises when differential accumulation moves into depth and the macroeconomic scene turns stagflationary. Then the two commitments clash and the winner is almost always dominant capital. Policy is ‘tightened’, presumably in order to rein in inflation; but the consequence tends to be the exact opposite: the pace of growth slows, heightening the crisis that dominant capital needs in order to keep inflation going.
Occasionally, policy tightening claims a big victory — for instance, during the early 1980s, when Fed Chairman Paul Volker was congratulated for ‘bringing inflation down’ by sharply hiking the rate of interest. But was tighter policy really the cause of lower inflation? As illustrated in Figure 15.2, by the early 1980s, dominant capital was already busy riding a new merger wave, having no appetite for further inflation. If this interpretation is correct, the real cause of disinflation was the resumption of breadth, with Volker and his restrictive policy merely playing catch up.
These considerations reveal a glimpse of the new state of capital. As Galileo Galilei reputedly observed:
Surely, God could have caused birds to fly with their bones made of solid gold, with their veins full of quicksilver, with their flesh heavier than lead, and with their wings exceedingly small. He did not, and that ought to show something.
(Quoted in Singh 2004: 73)293
In principle, ‘policy makers’ don’t have to line up for dominant capital. They can loosen policy when the largest firms demand tightening, and vice versa. They can restrict mergers and dismember capitalist giants. They can set prices, provide subsidies and impose different forms of taxation to undermine the differential accumulation of the leading corporations. They can even move toward a truly democratic society, where the citizens themselves make policy and dominant capital fades into oblivion.
These options are all open in principle — that is, assuming today’s ‘policy maker’ can even fathom them, let alone fathom them and retain their status as ‘officials’ of the capitalist state. But one way or the other, the systemic patterns of US differential accumulation suggest that these options are less and less open in practice. The officials and theorists of the state continue to talk about ‘policy autonomy’; but the content and direction of the policies themselves seem increasingly predicated on the capitalist creorder of differential accumulation.
For a typical tug-of-war approach to inflation, see Hirschman (1985).↩
For a fuller theoretical and empirical analysis of inflation and stagflation, including critiques of existing approaches, see Nitzan (1992; 2001), Bichler and Nitzan (2001: Ch. 5) and Nitzan and Bichler (2000; 2002: Ch. 4).↩
This and the next chapter illustrate our empirical arguments with available statistics of price and quantity aggregates. By using conventional data we keep the empirical critique at the same level as the theories and studies we challenge. For an alternative conceptualization that attempts to bypass the ‘quality’ trap of aggregation and devise alternative measures, see Nitzan (1992: Ch. 7).↩
For simplicity, our exposition here assumes that all output is sold.↩
We use the concepts of ‘productivity’ and ‘inputs’ here from the what-you-see-is-what-you-get perspective of capitalist executives; the theoretical impossibility of defining these concepts rarely hinders their practical computation.↩
Fortune stopped publishing employment data after 1993.↩
Figures in this paragraph are computed on the basis of data from Fortune, the U.S. Internal Revenue Service and the U.S. Bureau of Labor Statistics.↩
‘Big American companies’, writes The Economist, ‘fear that innovation is the secret of success — and that they cannot innovate’. Indeed, their ‘terror’ is that ‘innovation seems to work best outside of them’, a result of which ‘[m]uch of today’s merger boom is driven by a desperate search for new ideas’, with trading in intangible assets reaching $100 billion in 1998, up from $15 billion in 1990 (Anonymous 1999). ‘Nobody holds out for organic growth any more’, declares Sir Richard Sykes, chairman of Glaxo SmithKline, which in 1999 controlled 7.3 per cent of the world market for pharmaceuticals. According to a 2000 Financial Times survey in which he is cited, the reason has little to do with ‘efficiency gains’. Indeed, ‘Those wary of mergers’, reports the survey, ‘argue there is no evidence of scale contributing to greater efficiency. Ed Scolnick, chief scientist at Merck, found absolutely no correlation between the size and productivity of his company’s research laboratories. The relative success of small biotechnology companies suggests that scale in research may even be a disadvantage’. Of course, this is hardly a reason not to merge. As Jim Niedel of Glaxo points out in the same article, ‘doubling up’ (via merger) allows companies to screen twice as many compounds, not to mention the resulting increase in ‘salespower’ (Pilling 2000). In our terminology, it contributes to both internal breadth and external depth.↩
The term ‘stagflation’ was reputedly coined in the 1960s by British parliamentarian Ian Macleod and later popularized by Paul Samuelson (1974).↩
The patterns of US consumer prices (since the early nineteenth century) and of US wholesale prices (since the mid-eighteenth century) are remarkably similar to the UK ones shown in Figure 16.1.↩
Data for the United States are from Global Financial Data (series code: WPUSAM for the wholesale price index).↩
The US pattern is almost identical, although the magnitudes are smaller: between 1900 and 2007, consumer prices in the land of unlimited opportunities rose by only 2,700 per cent (computed from Global Financial Data [series code CPUSAM] and International Financial Statistics through Global Insight [series code: IMF:L64@C111]).↩
The story of the 1930s is more complicated than the aggregate data suggest. Recall from Chapter 12 that most of the price drop during the period happened in competitive industries. In the more concentrated industries prices remained relatively stable, and in some sectors they even rose.↩
This view is pervasive. ‘There cannot, in short, be intrinsically a more insignificant thing, in the economy of society, than money’, tells us John Stuart Mill (1848: Book 3, Ch. 7). Arthur Pigou wrote a whole book to debate The Veil of Money (1949), and Franco Modigliani informs us that ‘Money is “neutral”, a “veil” with no consequences for real economic magnitudes’ (Papademos and Modigliani 1990: 405). And since, according to Milton Friedman (1968: 98), ‘inflation is always and everywhere a monetary phenomenon’, it follows that an overall increase in money prices, however annoying, is neutral in the grander scheme of things (on the origins of the terms ‘veil of money’ and ‘neutrality of money’, see Patinkin and Steiger 1989).↩
Note that the equivalence of the two definitions breaks down once we admit that commodities cannot be aggregated into an overall ‘quantity’ (Chapter 8). However, since economists are generally indifferent to this impossibility, we don’t press it in this chapter.↩
The following is a technical note for those interested in the fine print. Mainstream economists would readily admit that in reality prices do not all change at the same rate, and that relative price variations may even be positively correlated with the rate of inflation (see for instance Parks 1978). But these relative variations, they would add, neither cause inflation nor bear on its consequences.
First, in a competitive market relative price variations reflect changes in consumer preferences (marginal utility) and technology (marginal productivity), and in that sense have little to do with overall inflation. Second, ‘disequilibrium’ prices — namely, those that do not reflect the underlying logic of utility and productivity — may exist, but only temporarily. Soon enough, the market would force them back to their ‘proper’ equilibrium levels. And finally, during inflation deviations from equilibrium prices arise mostly from misguided expectations and therefore are never systematic in their pattern. These deviations could make some ‘agents’ richer and others poorer, but only by fluke. Disequilibrium prices could also arise from ‘government intervention’ and ‘monopoly practices’ (mainly by labour unions), but the redistributional effect is nullified once agents become aware of these ‘imperfections’ and ‘discount’ them into their demand and supply. Moreover, regardless of their redistributional impact, these ‘imperfections’ cannot translate into inflation unless validated by increases in overall liquidity.
Unfortunately, this line of defence is persuasive only to those who erect it. First, marginal utility and productivity are never observable, so there is no way to know the ‘equilibrium’ price that equates them. Second, equilibrium prices, as their name suggests, hold only in equilibrium. But since we never know whether we are in equilibrium or disequilibrium, we never know which prices are ‘out of line’. Finally, it is unclear why we should assume that inflation does not systematically redistribute income. To argue that market forces prevent such systematic redistribution may be a meaningful explanation for an observed outcome. But shouldn’t we first establish that this is indeed the outcome?↩Inflation is also related to the distribution of assets, a topic to which we return later in the chapter.↩
Notice that the peaks of the income ratio in Figure 16.2 coincide with the peaks in the foreign-to-total profit ratio in Figure 15.6.↩
For a similarly tight correlation using monthly rather than annual data since 1999, see Nitzan and Bichler (2006a: p. 22, Figure 4). In principle, the analysis could benefit from matching the international sources of profits with the corresponding national rates of inflation. However, given the convergence of global inflation rates since the 1990s, the insight added by this exercise is likely to be limited.↩
A more complete analysis of capitalist income would consider corporate interest payments as well as net profit.↩
The reason for the tight match is simple to explain. The markup is given by the following expression:
\[ markup = \frac{profit}{sales} = \frac{profit~per~employee}{sales~per~employee} \]
As noted earlier in the chapter, differential sales per employee have changed very gradually and only by a little (increasing by 20 per cent over the period 1950–93). This relative stability causes fluctuations in the differential markup to be more or less fully expressed as fluctuations in differential profit per employee.↩
For evidence and analysis of the same process in Israel and South Africa, see Nitzan and Bichler (2000; 2001).↩
For a critical discussion of markup theories of inflation, see Nitzan (1992: Ch. 4).↩
To illustrate, think of East Asia during the 1990s, where annual growth rates of nearly 10 per cent were associated with falling export prices. Was there anything mysterious about this combination of growth and deflation? Not really. Despite the rapid growth (or rather because of that growth), the investment-to-GDP ratio kept rising, while East-Asian companies kept undercutting each other in a hyper-competitive trench war. No wonder their prices kept falling (see Nitzan 1997: p. 12, Chart 4).↩
During the mid-2000s, many experts considered the bout of commodity-led inflation as indisputable evidence of ‘real’ shortage. The world, they said, was ‘running out of resources’ — primarily fossil fuels — and as ‘demand exceeds supply’ prices inevitably rise. This claim is hardly novel. It was marshaled by the Club of Rome during the previous commodity crisis (boom?) of the 1970s, and by numerous earlier observers inspired by the social ecology of Thomas Malthus.
But the argument rarely sits well with the facts. To illustrate, note that the global quantity of oil reserves and the theories of their ultimate peak and depletion have hardly changed over the last thirty years. By contrast, the ‘real’ price of oil oscillated widely: measured in 2007 US dollars, it rose from less than $10 a barrel in 1970 to $108 in 1979, fell to $13 in 1998 and soared to $150 in 2008 (only to fall back to less than $115 as these lines are written).
This mismatch isn’t difficult to explain. Mother Nature does impose real limits, but natural limits do not determine prices. Ownership does. Recall that price implies restriction, and restriction presupposes ownership. This prerequisite means that natural limits can have no bearing on prices unless they are mediated through the power conferred by ownership. The ozone layer, clean water and ocean fish stocks, to name a few obvious examples, are as physically limited as oil is. Yet having no owners to restrict their use and therefore no prices, they cannot be made ‘scarce’. By contrast, oil is tightly owned, mostly by governments of oil-producing countries and large petroleum companies. And it is the historical variations in the relative power of these owners — exercised mostly through the high politics of crisis and war — that explains why the price of oil varies so dramatically while its actual ‘availability’ does not (see for instance Nitzan and Bichler 1995: 487–92). Note that even when oil finally becomes nearly exhausted, there will be nothing to prevent its owners from giving it away for free if they so wished.↩
The extreme instability engendered by the German inflation of the 1920s is described with much panache in Stefan Zweig’s memoirs, The World of Yesterday (1943: Ch. XIII). Inverted, this account tells us how the different qualitative aspects of social instability are manifested in the universal quantities of inflation.↩
This quote is often referenced to Galileo’s Dialogue Concerning the Two Chief World Systems (1632), although we were unable to find it in the English translation of that text.↩